After more than a year and a half of a red-hot residential real estate market with high competition and record prices, recent months have shown some signs that the market is finally beginning to cool.
Part of the reason for this is seasonal, as the fall and winter months typically see a lower volume of home sales than the spring and summer. Other observers have suggested that a sharp increase in home values over the last 18 months has begun to price more would-be homebuyers out of the market. But one of the biggest factors is that after reaching record lows last year, the inventory of homes for sale began to turn upward this summer, finally bringing more supply into the market.
Much of this growth in inventory comes from an increase in the sale of existing homes as more owners recognize favorable market conditions and opt to sell. According to the National Association of Realtors, sales of existing homes were up 7% month-over-month in September. In contrast, new construction has been more challenging: new housing starts have rebounded to pre-pandemic levels, but completions have trended downward among ongoing labor shortages and supply chain challenges.
All else being equal, a majority of homebuyers express a preference for new houses. According to a survey from the National Association of Home Builders, 60% of buyers would prefer a new home over an existing one. But given the constraints on the supply of new housing, many more homebuyers are looking to the stock of existing homes as a desirable option.
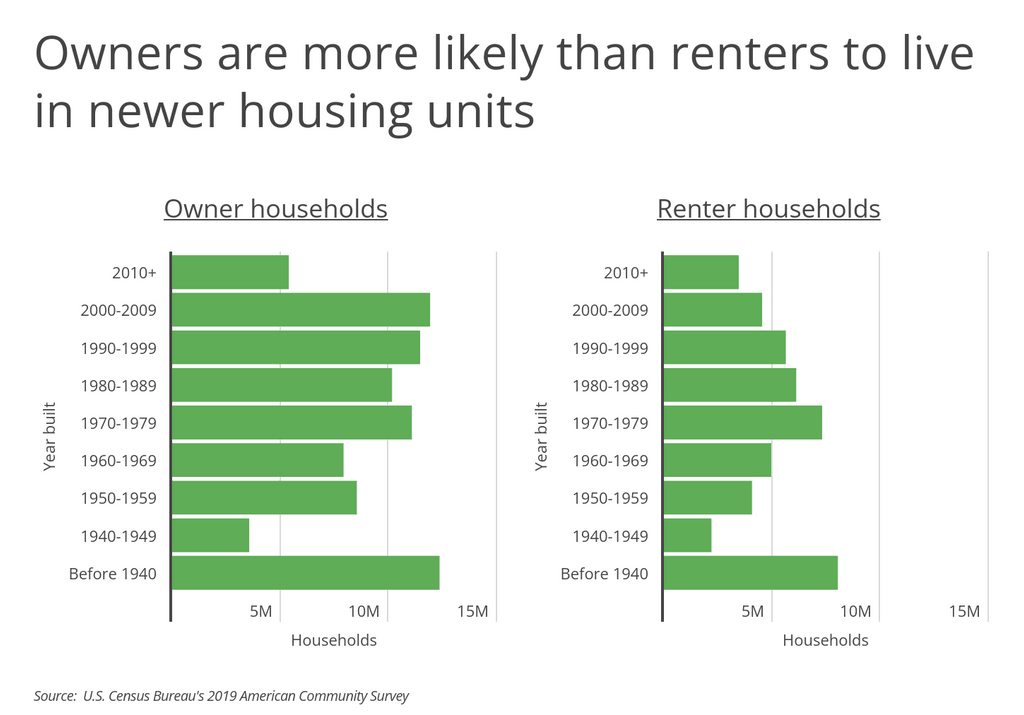
Homebuyers’ preferences for newer homes is apparent in data on homes’ years of construction. Approximately 35% of homeowners live in a unit constructed since 1990, compared to just 29% of renters. Because homeowners have a greater financial stake in the places they live, they may be more motivated than renters to seek out new residences, which offer lower ongoing maintenance costs, newer (and frequently safer) building materials, and less worry about major expenses like new appliances, HVAC, or roofing.
But one of the downsides of newer homes is that they tend to be much more expensive than older units for both owners (by median home value) and renters (by median monthly rent). The median value of owner-occupied housing units built since 2010 ($339,039) is more than $50,000 greater than those built just in the decade prior ($288,500), according to the Census Bureau.
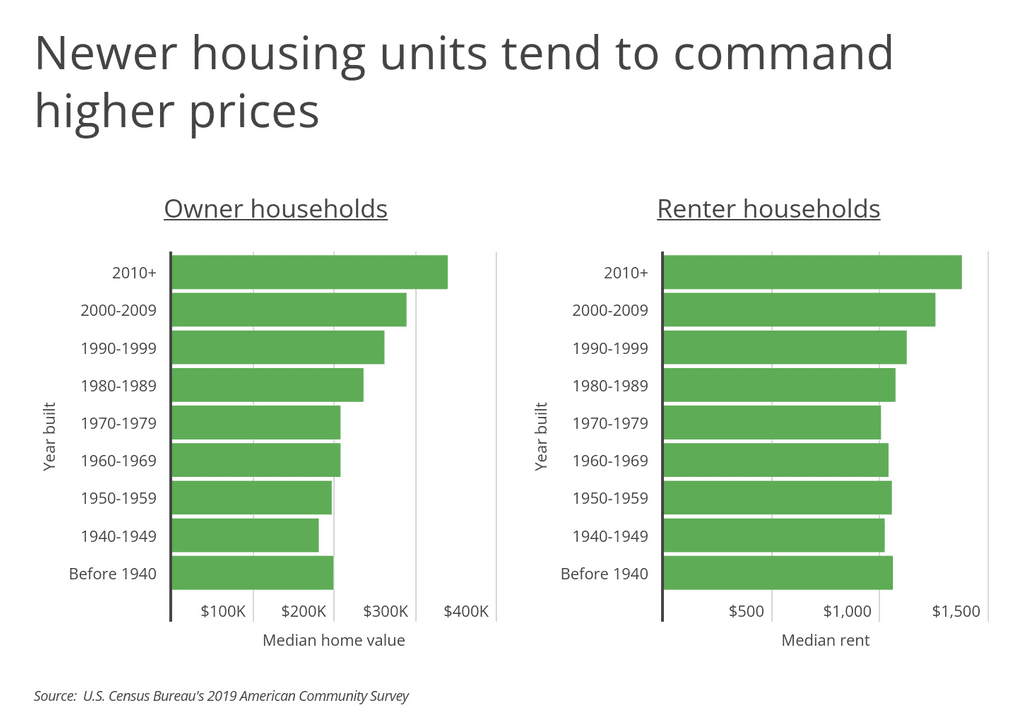
This difference in value is in part because newer units reflect current costs, which includes more expensive labor and materials, and in part because homebuilders in recent years have been making homes larger. These factors have become even more significant during the pandemic, as labor and supply chain challenges have pushed building costs upward, while many homebuyers have been seeking larger spaces. With prices for new homes high and rising, homebuyers may find the best value looking for older properties.
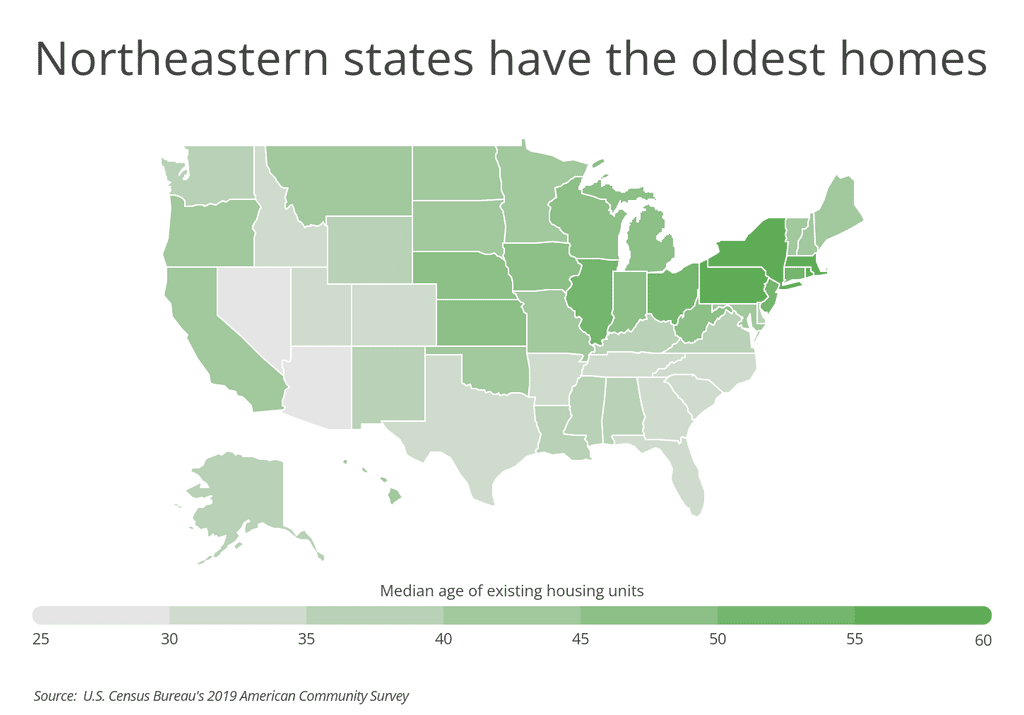
The supply of newer and older homes looks different depending on geography, which impacts how these trends in the real estate and rental markets play out. The median age of existing housing units is oldest in Northeastern states like New York and Massachusetts, where cities have been established for longer and their higher densities make new construction more difficult. Sun Belt states like Nevada and Arizona in the West and Georgia and North Carolina in the South have been experiencing much higher rates of growth in recent decades, and as a result the typical home has a lower age. At the metro level, similar trends hold, with older homes being found in the nation’s historic population centers, including industrial cities like Buffalo, Pittsburgh, and Cleveland.
The data used in this analysis is from the U.S. Census Bureau’s American Community Survey. To determine the locations with the oldest homes, researchers at Inspection Support Network calculated the median age of the existing housing stock, including both owner-occupied and renter-occupied units. In the event of a tie, the location with the higher percentage and/or number of housing units built prior to 1940 was ranked higher. To improve relevance, only metropolitan areas with at least 100,000 residents were included.
Here are the metros with the oldest homes.
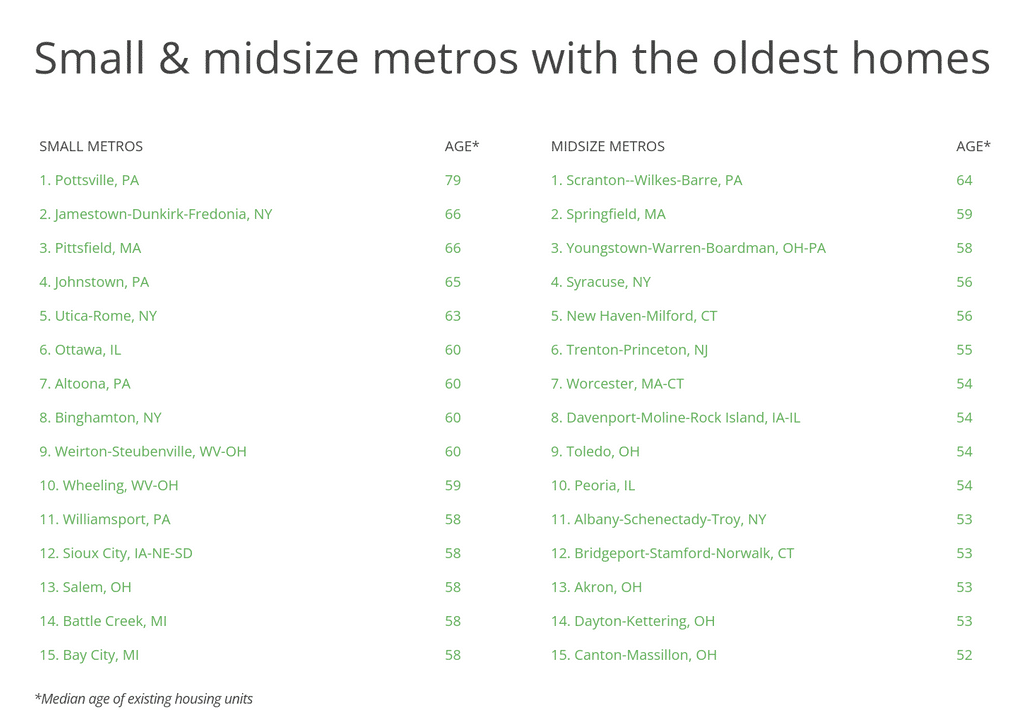
Large Metros With the Oldest Homes

15. St. Louis, MO-IL
- Median age of existing housing units: 47
- Percentage of housing units built prior to 1940: 16.4%
- Total housing units built prior to 1940: 208,218
- Percentage of housing built in 2000 or later: 16.3%
- Total housing units built in 2000 or later: 207,171

14. Chicago-Naperville-Elgin, IL-IN-WI
- Median age of existing housing units: 49
- Percentage of housing units built prior to 1940: 20.7%
- Total housing units built prior to 1940: 800,679
- Percentage of housing built in 2000 or later: 14.6%
- Total housing units built in 2000 or later: 563,706

13. Los Angeles-Long Beach-Anaheim, CA
- Median age of existing housing units: 52
- Percentage of housing units built prior to 1940: 12.0%
- Total housing units built prior to 1940: 562,864
- Percentage of housing built in 2000 or later: 10.0%
- Total housing units built in 2000 or later: 468,197
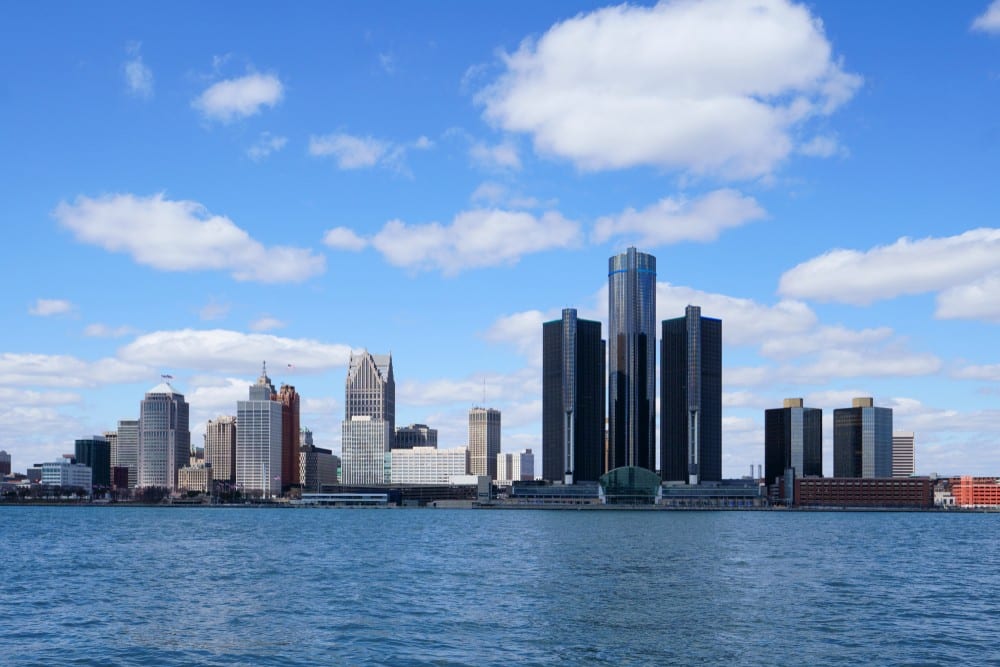
12. Detroit-Warren-Dearborn, MI
- Median age of existing housing units: 52
- Percentage of housing units built prior to 1940: 12.7%
- Total housing units built prior to 1940: 243,731
- Percentage of housing built in 2000 or later: 11.7%
- Total housing units built in 2000 or later: 223,794

11. San Francisco-Oakland-Berkeley, CA
- Median age of existing housing units: 53
- Percentage of housing units built prior to 1940: 19.4%
- Total housing units built prior to 1940: 357,597
- Percentage of housing built in 2000 or later: 12.2%
- Total housing units built in 2000 or later: 223,822

10. Hartford-East Hartford-Middletown, CT
- Median age of existing housing units: 53
- Percentage of housing units built prior to 1940: 19.5%
- Total housing units built prior to 1940: 100,927
- Percentage of housing built in 2000 or later: 9.6%
- Total housing units built in 2000 or later: 49,874
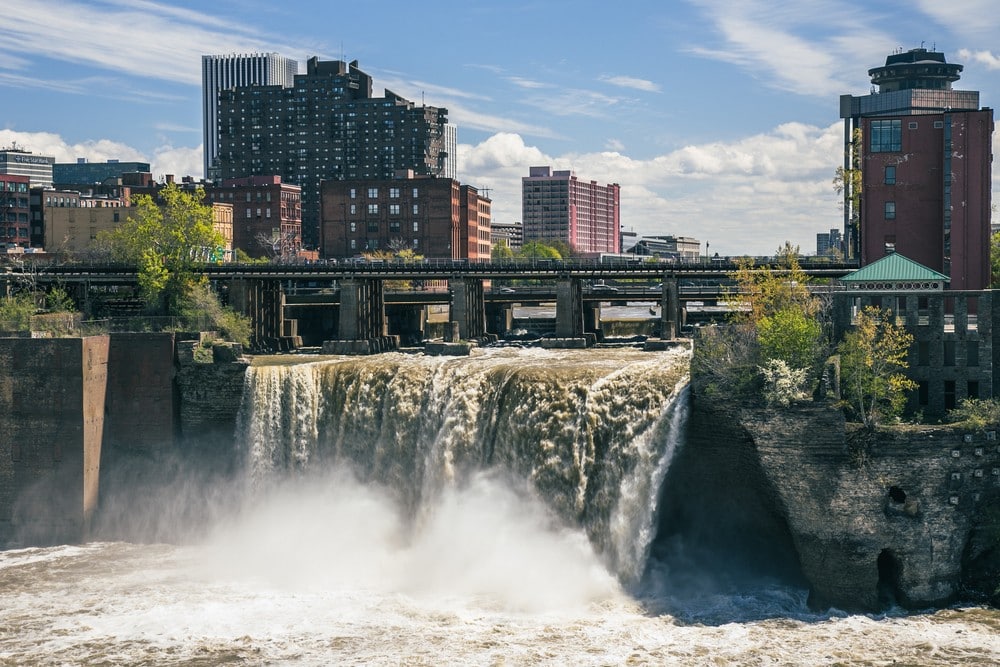
9. Rochester, NY
- Median age of existing housing units: 54
- Percentage of housing units built prior to 1940: 28.1%
- Total housing units built prior to 1940: 136,064
- Percentage of housing built in 2000 or later: 10.4%
- Total housing units built in 2000 or later: 50,442
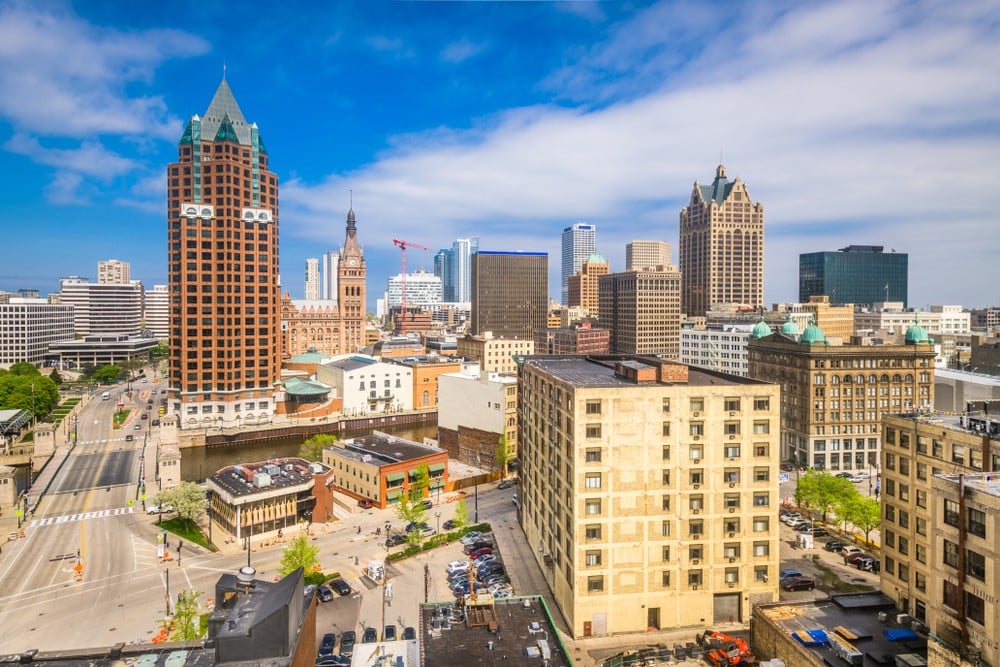
8. Milwaukee-Waukesha, WI
- Median age of existing housing units: 55
- Percentage of housing units built prior to 1940: 22.0%
- Total housing units built prior to 1940: 150,612
- Percentage of housing built in 2000 or later: 11.5%
- Total housing units built in 2000 or later: 78,601

7. Philadelphia-Camden-Wilmington, PA-NJ-DE-MD
- Median age of existing housing units: 55
- Percentage of housing units built prior to 1940: 22.6%
- Total housing units built prior to 1940: 566,040
- Percentage of housing built in 2000 or later: 11.9%
- Total housing units built in 2000 or later: 297,410

6. Boston-Cambridge-Newton, MA-NH
- Median age of existing housing units: 57
- Percentage of housing units built prior to 1940: 32.6%
- Total housing units built prior to 1940: 646,900
- Percentage of housing built in 2000 or later: 13.0%
- Total housing units built in 2000 or later: 258,246

5. Cleveland-Elyria, OH
- Median age of existing housing units: 58
- Percentage of housing units built prior to 1940: 23.6%
- Total housing units built prior to 1940: 227,382
- Percentage of housing built in 2000 or later: 9.7%
- Total housing units built in 2000 or later: 93,217
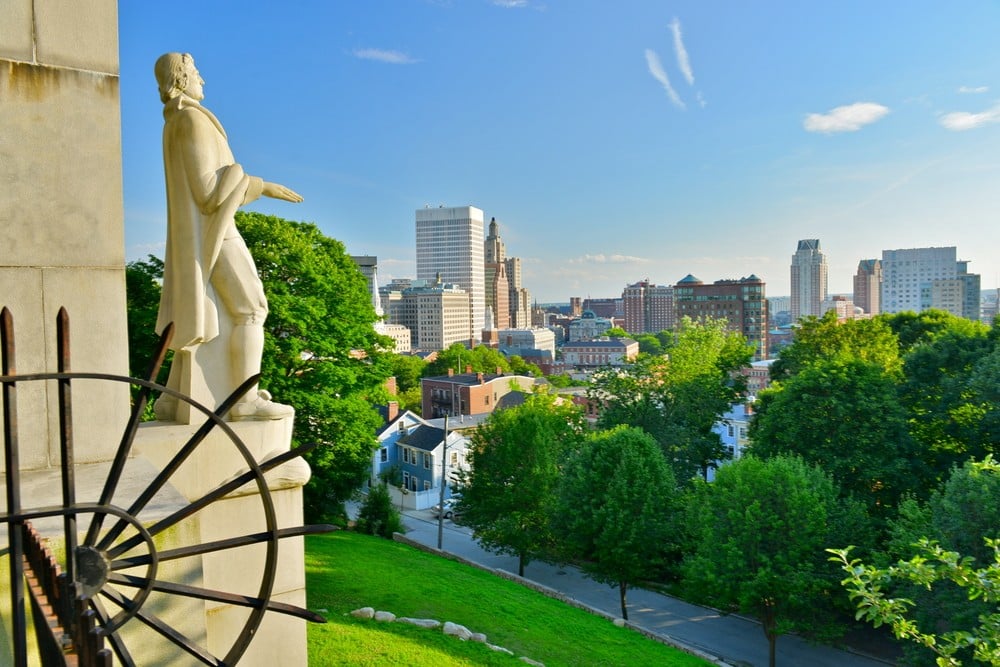
4. Providence-Warwick, RI-MA
- Median age of existing housing units: 58
- Percentage of housing units built prior to 1940: 31.1%
- Total housing units built prior to 1940: 219,952
- Percentage of housing built in 2000 or later: 8.1%
- Total housing units built in 2000 or later: 57,081

3. Pittsburgh, PA
- Median age of existing housing units: 60
- Percentage of housing units built prior to 1940: 26.1%
- Total housing units built prior to 1940: 295,410
- Percentage of housing built in 2000 or later: 10.2%
- Total housing units built in 2000 or later: 116,126

2. New York-Newark-Jersey City, NY-NJ-PA
- Median age of existing housing units: 60
- Percentage of housing units built prior to 1940: 27.7%
- Total housing units built prior to 1940: 2,163,115
- Percentage of housing built in 2000 or later: 10.5%
- Total housing units built in 2000 or later: 819,388
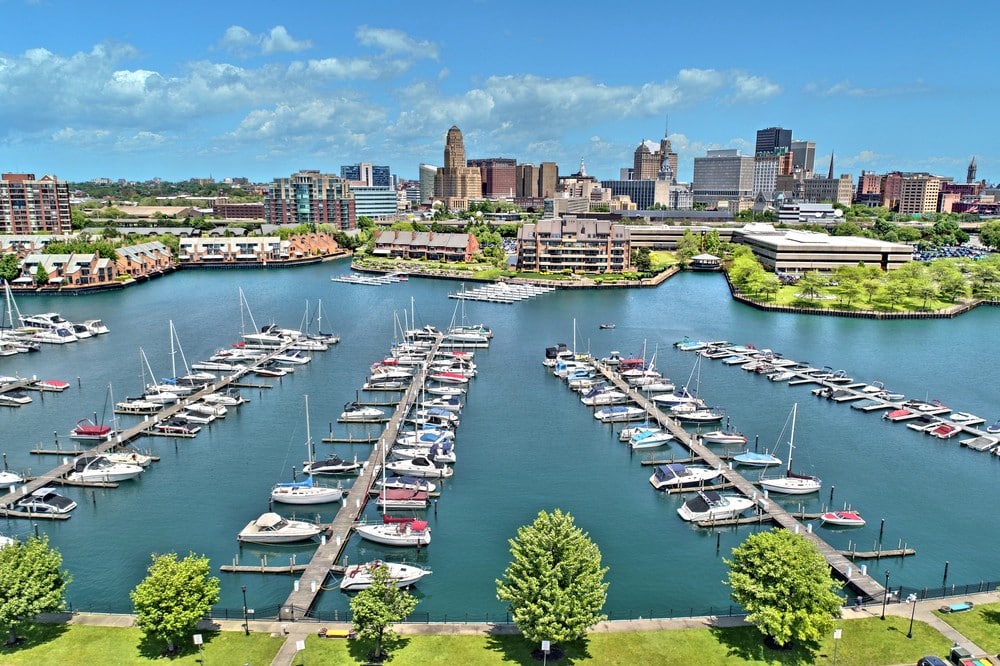
1. Buffalo-Cheektowaga, NY
- Median age of existing housing units: 63
- Percentage of housing units built prior to 1940: 29.6%
- Total housing units built prior to 1940: 157,064
- Percentage of housing built in 2000 or later: 8.4%
- Total housing units built in 2000 or later: 44,768
Detailed Findings & Methodology
The data used in this analysis is from the U.S. Census Bureau’s 2019 American Community Survey. To determine the locations with the oldest homes, researchers calculated the median age of existing housing units, including both owner-occupied and renter-occupied units. In the event of a tie, the location with the higher percentage and/or number of housing units built prior to 1940 was ranked higher. To improve relevance, only metropolitan areas with at least 100,000 residents were included. Additionally, metros were grouped into cohorts based on population size: small (100,000–349,999), midsize (350,000–999,999), and large (1,000,000 or more).

