Even before COVID-19, real estate agents were adopting new technologies as a way to connect with young, tech-savvy home buyers. However, like so many other economic sectors, the real estate industry has been forced to expand these practices in response to social distancing measures. Now, virtual open houses and watch parties are the norm, and even formerly non-tech-savvy agents are embracing online document software and drone photography to comply with new restrictions.
Even with recent economic disruptions and high levels of unemployment, the real estate industry remains strong. Data from the S&P/Case-Shiller U.S. National Home Price Index reveals that home prices—fueled by strong demand and a limited supply—continue to rise.
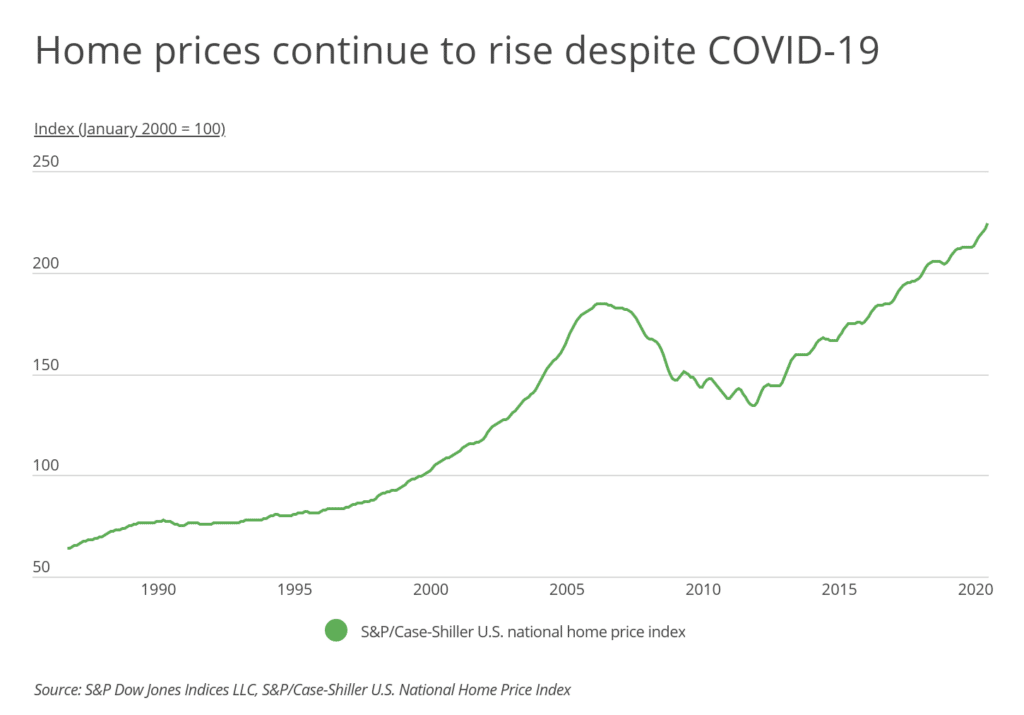
Mortgage interest rates have been trending downward, hitting the lowest levels in the 50-year history of Freddie Mac’s Primary Mortgage Market Survey. At the beginning of December, average mortgage rates were nearly a full percentage point lower than the 3.68% rate observed in December 2019 for 30-year fixed-rate mortgages. Due to a combination of historically low interest rates and increased demand—in part, resulting from COVID-19—many real estate agents are busier than ever.
Data from the Bureau of Labor Statistics’ Occupational Employment Statistics reveals that the concentration of real estate agents and their typical pay varies significantly by location. While the highest densities of agents are located in the South, the highest wages (after adjusting for living costs) are primarily found in the Northeast and West.
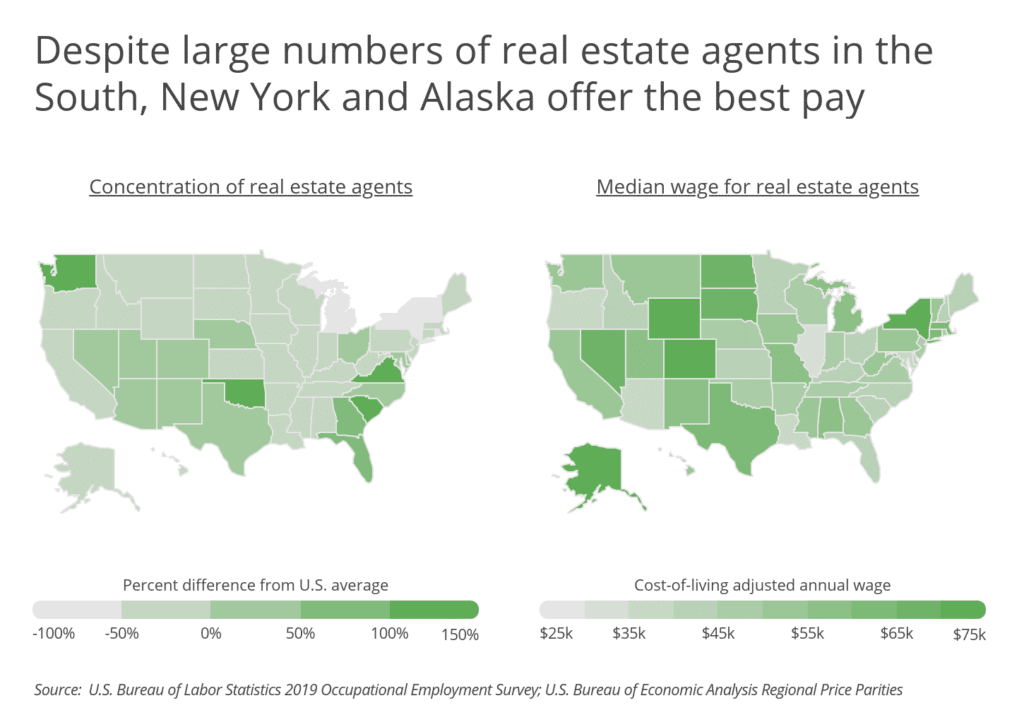
To identify the best-paying metropolitan areas for real estate agents, researchers at Inspection Support Network (ISN) analyzed data from the U.S. Bureau of Labor Statistics and U.S. Bureau of Economic Analysis to calculate cost-of-living adjusted median annual wages. In expensive metros, wages for real estate agents were adjusted down to reflect less purchasing power; whereas, in more affordable locations, wages were adjusted up to reflect greater purchasing power. ISN also calculated the relative concentration of real estate agents in each location compared to the U.S. average.
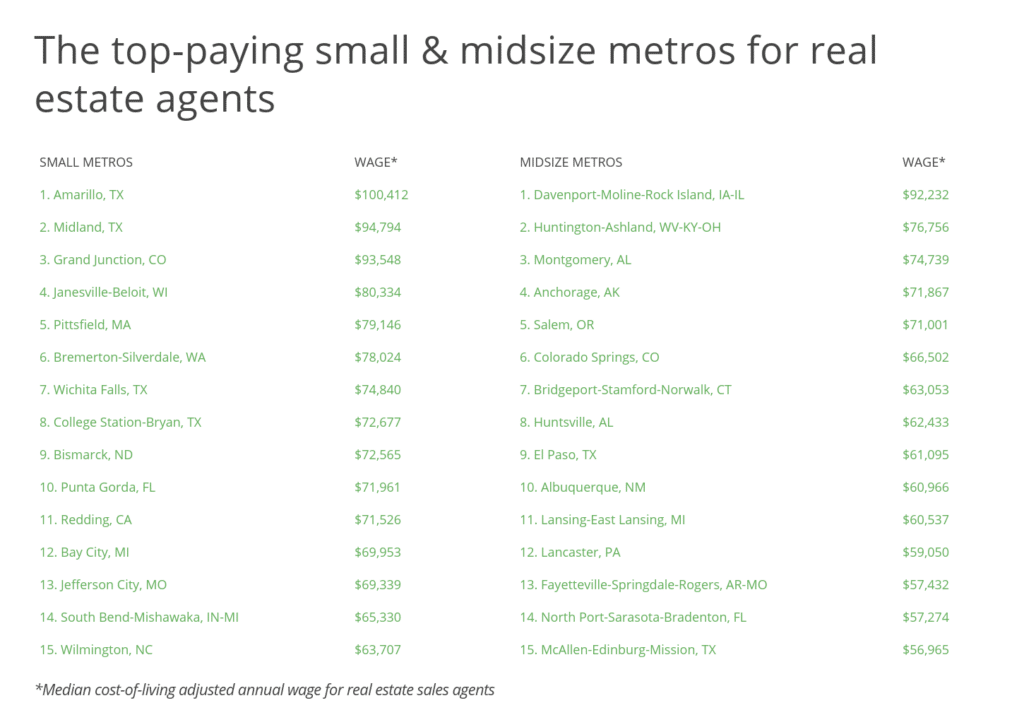
The highest paying cities for real estate agents are dispersed throughout the country and represent a diverse set of cities. Real estate agents looking for high pay can choose between a number of metros in every region of the country. However, one important caveat is that this analysis draws from data collected prior to the pandemic, and the subsequent changes to the real estate market could have lasting effects on where future buyers are searching for homes.
Here are metros with the highest cost-of-living-adjusted wages for real estate agents.
The Top-Paying Large Metros for Real Estate Agents

Photo Credit: Alamy Stock Photo
15. San Diego-Carlsbad, CA
- Median wage for real estate agents (adjusted): $57,723
- Median wage for real estate agents (unadjusted): $67,190
- Median wage for all workers (unadjusted): $45,050
- Cost of living (compared to U.S. average): +16.4%
- Concentration of real estate agents (compared to U.S. average): -53.0%
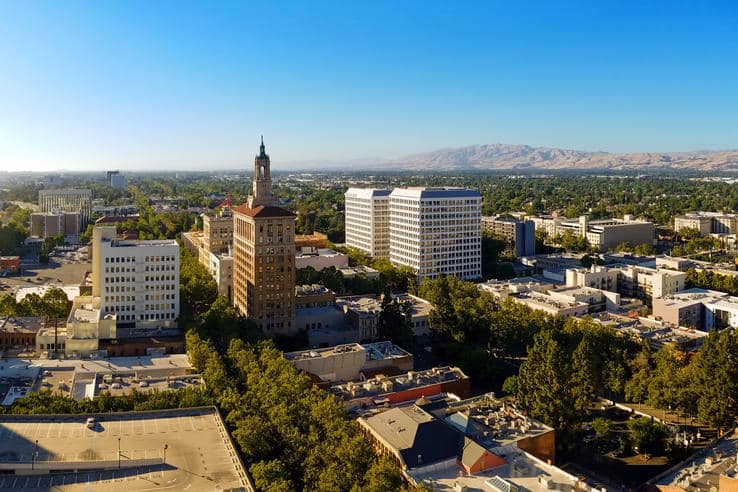
Photo Credit: Alamy Stock Photo
14. San Jose-Sunnyvale-Santa Clara, CA
- Median wage for real estate agents (adjusted): $58,462
- Median wage for real estate agents (unadjusted): $75,650
- Median wage for all workers (unadjusted): $61,980
- Cost of living (compared to U.S. average): +29.4%
- Concentration of real estate agents (compared to U.S. average): -55.0%

Photo Credit: Alamy Stock Photo
13. Detroit-Warren-Dearborn, MI
- Median wage for real estate agents (adjusted): $58,565
- Median wage for real estate agents (unadjusted): $55,930
- Median wage for all workers (unadjusted): $41,620
- Cost of living (compared to U.S. average): -4.5%
- Concentration of real estate agents (compared to U.S. average): -46.0%

Photo Credit: Alamy Stock Photo
12. Boston-Cambridge-Nashua, MA-NH
- Median wage for real estate agents (adjusted): $59,387
- Median wage for real estate agents (unadjusted): $67,820
- Median wage for all workers (unadjusted): $53,300
- Cost of living (compared to U.S. average): +14.2%
- Concentration of real estate agents (compared to U.S. average): -46.0%

Photo Credit: Alamy Stock Photo
11. Birmingham-Hoover, AL
- Median wage for real estate agents (adjusted): $59,628
- Median wage for real estate agents (unadjusted): $52,890
- Median wage for all workers (unadjusted): $38,020
- Cost of living (compared to U.S. average): -11.3%
- Concentration of real estate agents (compared to U.S. average): +38.0%

Photo Credit: Alamy Stock Photo
10. Memphis, TN-MS-AR
- Median wage for real estate agents (adjusted): $60,543
- Median wage for real estate agents (unadjusted): $54,610
- Median wage for all workers (unadjusted): $35,540
- Cost of living (compared to U.S. average): -9.8%
- Concentration of real estate agents (compared to U.S. average): -29.0%

Photo Credit: Alamy Stock Photo
9. Sacramento–Roseville–Arden-Arcade, CA
- Median wage for real estate agents (adjusted): $61,245
- Median wage for real estate agents (unadjusted): $63,450
- Median wage for all workers (unadjusted): $44,590
- Cost of living (compared to U.S. average): +3.6%
- Concentration of real estate agents (compared to U.S. average): -51.0%

Photo Credit: Alamy Stock Photo
8. Austin-Round Rock, TX
- Median wage for real estate agents (adjusted): $61,747
- Median wage for real estate agents (unadjusted): $61,870
- Median wage for all workers (unadjusted): $41,560
- Cost of living (compared to U.S. average): +0.2%
- Concentration of real estate agents (compared to U.S. average): +60.0%

Photo Credit: Alamy Stock Photo
7. New York-Newark-Jersey City, NY-NJ-PA
- Median wage for real estate agents (adjusted): $65,802
- Median wage for real estate agents (unadjusted): $81,660
- Median wage for all workers (unadjusted): $48,840
- Cost of living (compared to U.S. average): +24.1%
- Concentration of real estate agents (compared to U.S. average): -47.0%

Photo Credit: Alamy Stock Photo
6. Houston-The Woodlands-Sugar Land, TX
- Median wage for real estate agents (adjusted): $67,348
- Median wage for real estate agents (unadjusted): $68,560
- Median wage for all workers (unadjusted): $40,570
- Cost of living (compared to U.S. average): +1.8%
- Concentration of real estate agents (compared to U.S. average): +47.0%

Photo Credit: Alamy Stock Photo
5. Pittsburgh, PA
- Median wage for real estate agents (adjusted): $68,120
- Median wage for real estate agents (unadjusted): $63,420
- Median wage for all workers (unadjusted): $40,570
- Cost of living (compared to U.S. average): -6.9%
- Concentration of real estate agents (compared to U.S. average): +31.0%

Photo Credit: Alamy Stock Photo
4. Las Vegas-Henderson-Paradise, NV
- Median wage for real estate agents (adjusted): $70,671
- Median wage for real estate agents (unadjusted): $68,410
- Median wage for all workers (unadjusted): $35,660
- Cost of living (compared to U.S. average): -3.2%
- Concentration of real estate agents (compared to U.S. average): +63.0%

Photo Credit: Alamy Stock Photo
3. Dallas-Fort Worth-Arlington, TX
- Median wage for real estate agents (adjusted): $70,884
- Median wage for real estate agents (unadjusted): $71,380
- Median wage for all workers (unadjusted): $40,430
- Cost of living (compared to U.S. average): +0.7%
- Concentration of real estate agents (compared to U.S. average): +29.0%

Photo Credit: Alamy Stock Photo
2. Denver-Aurora-Lakewood, CO
- Median wage for real estate agents (adjusted): $74,404
- Median wage for real estate agents (unadjusted): $78,050
- Median wage for all workers (unadjusted): $47,440
- Cost of living (compared to U.S. average): +4.9%
- Concentration of real estate agents (compared to U.S. average): +41.0%
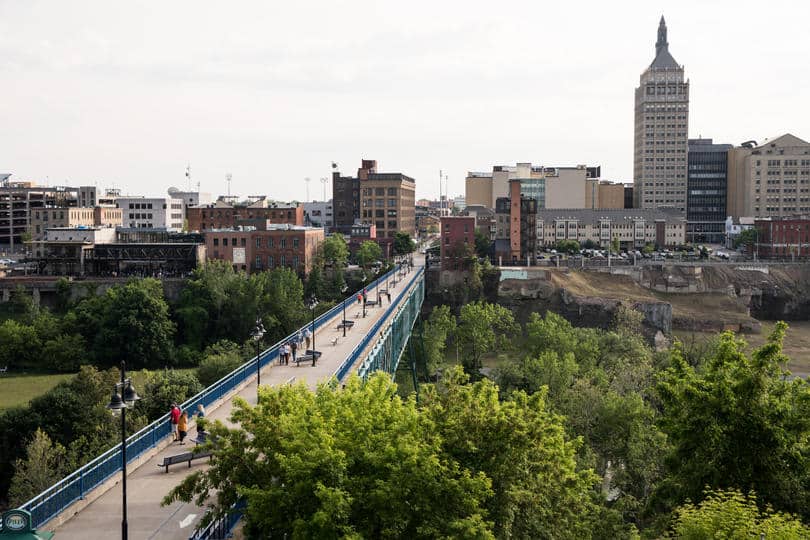
Photo Credit: Alamy Stock Photo
1. Rochester, NY
- Median wage for real estate agents (adjusted): $74,821
- Median wage for real estate agents (unadjusted): $73,100
- Median wage for all workers (unadjusted): $40,070
- Cost of living (compared to U.S. average): -2.3%
- Concentration of real estate agents (compared to U.S. average): -73.0%
Methodology & Detailed Findings
The wage and employment data used in this analysis is from the U.S. Bureau of Labor Statistics 2019 Occupational Employment Survey, which covers wage and salary workers in non-farm establishments. The cost-of-living data is from the U.S. Bureau of Economic Analysis Regional Price Parities. To identify the best-paying locations for real estate agents, cost-of-living adjusted median annual wages were calculated. In expensive locations, wages were adjusted down to reflect lower purchasing power; whereas, in more affordable locations, wages were adjusted up to reflect more purchasing power. Researchers also included the relative concentration of real estate agents in each location compared to the U.S. average. This statistic is the percentage difference between the concentration of real estate agents in the given location and the concentration of real estate agents in the U.S. as a whole.
Only metropolitan areas with at least 100,000 residents and available data from the BLS were included in the analysis. Additionally, metros were grouped based on population: small (100,000–349,999), midsize (350,000–999,999), and large (1,000,000 or more).

