September’s housing data shows a market in transition. Sales dipped again, but inventory climbed to its highest level since 2020, potentially giving buyers more breathing room and inspectors a steadier flow of contracts heading into the winter months.
Sales and inventory
- Existing home sales totaled 357,000 in September, down –5.1% from August but +8.2% YoY
- Year-to-date sales are now down –0.2%
- Active listings reached 1.56 million homes (+21.9% YoY), marking the largest supply since 2020, according to HouseCanary
- Month’s supply climbed to 5.49, edging toward a buyer’s market
Contracts and pricing
- HouseCanary reports 283,409 homes went under contract, up +11.0% YoY
- Price cuts rose +21.6% YoY, remaining at their highest level since 2020
- The median closed price increased +3.5% YoY to $433,239
- The national median existing home price was $415,200, a +2.1% YoY gain
- Regionally, the Midwest (+4.7%) and Northeast (+4.1%) led, while the West (+0.4%) remained flat
Mortgage rates
- Mortgage rates averaged 6.6% in Q3
- Fannie Mae now projects rates to decline more gradually to 6.2% by early 2026 and 5.9% by the end of the year, while the Mortgage Bankers Association expects rates to stay near 6.5% through 2028
Current forecasts
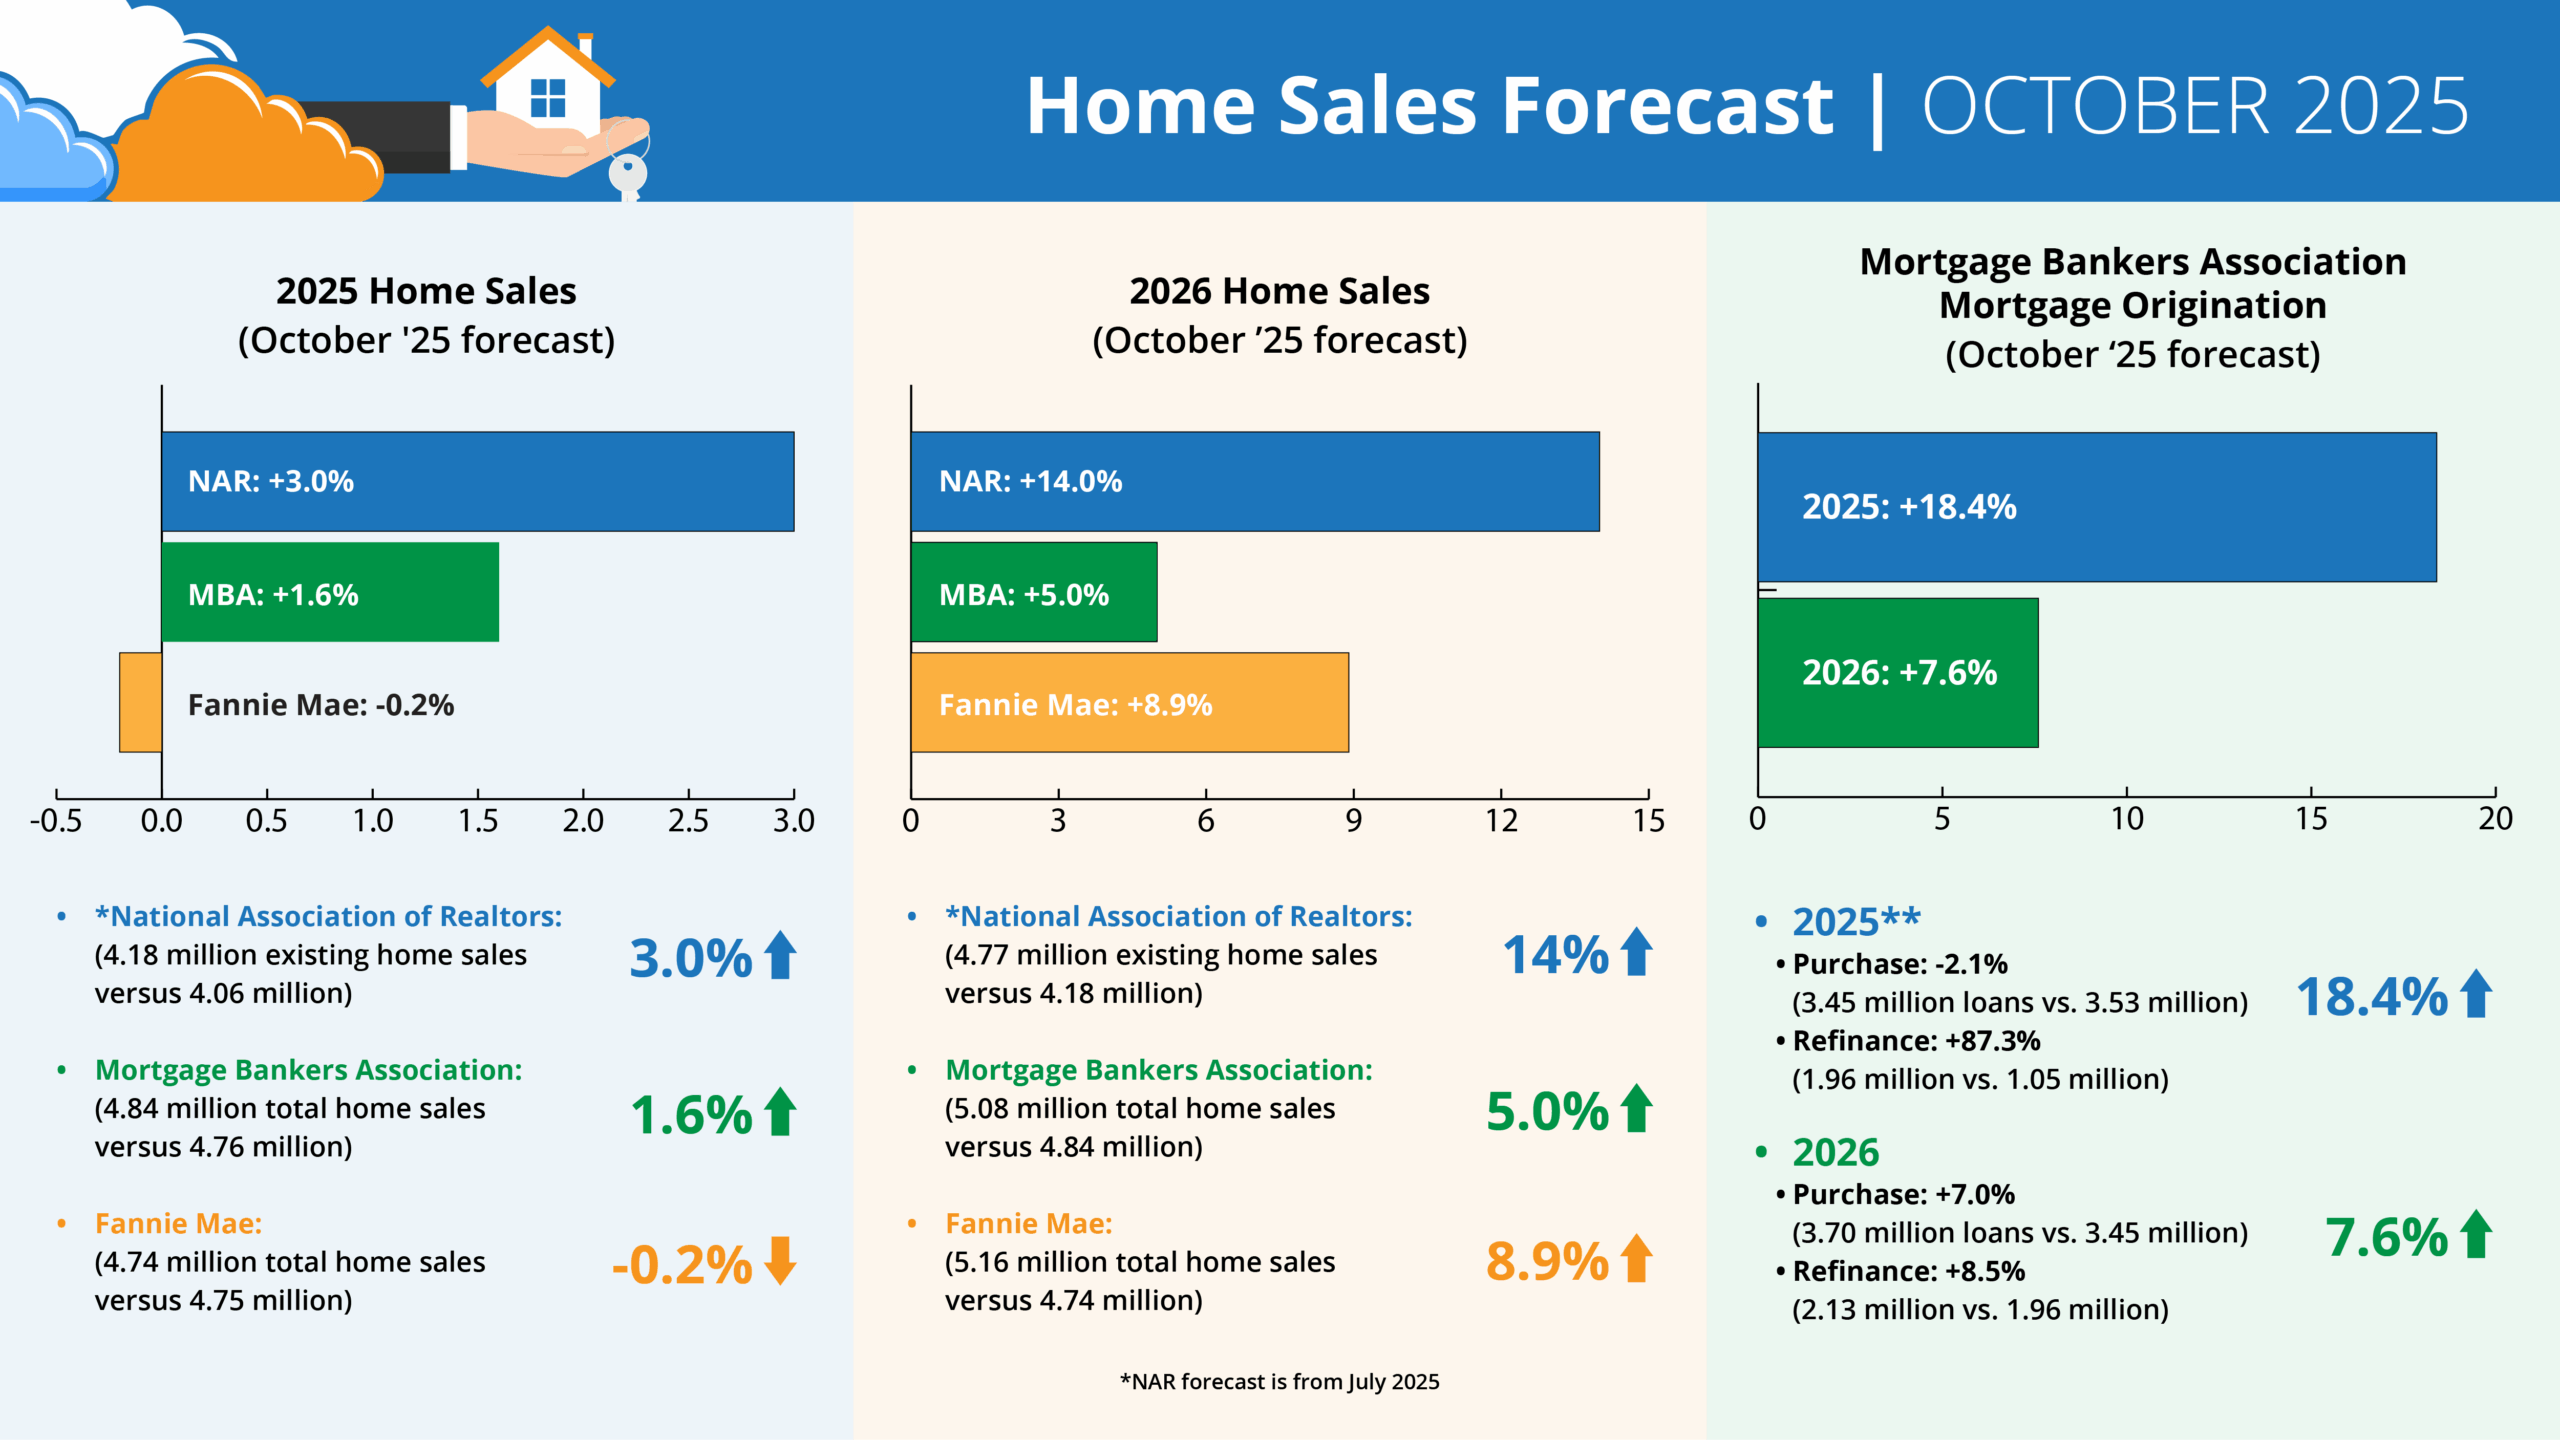
Forecasts for 2025 home sales (October ‘25 forecast)
- *NAR: +3.0% (4.18 million existing home sales vs. 4.06 million)
- MBA: +1.6% (4.84 million total home sales vs. 4.76 million)
- Fannie: -0.2% (4.74 million total home sales vs. 4.75 million)
Forecasts for 2026 Home Sales (October ’25 forecast)
- *NAR: +14.0% (4.77 million existing home sales vs. 4.18 million)
- MBA: +5.0% (5.08 million total home sales vs. 4.84 million)
- Fannie: +8.9% (5.16 million total home sales vs. 4.74 million)
MBA Forecast for Mortgage Originations (October ’25 forecast)
- 2025** Total Mortgage Originations: +18.4% (5.41 million loans vs. 4.57 million)
- Purchase: -2.1% (3.45 million loans vs. 3.53 million)
- Refi: +87.3% (1.96 million vs. 1.05 million)
- 2026 Total Mortgage Originations: +7.6% (5.82 million loans vs. 5.41 million)
- Purchase: +7.0% (3.70 million loans vs. 3.45 million)
- Refi: +8.5% (2.13 million vs. 1.96 million)
* NAR forecast is from July 2025
What it means for inspectors
For inspectors, the data shows a steadier, if slightly cooler, market. Listings are rising faster than sales, but contracts are holding strong. That balance could keep inspection pipelines active, especially as motivated sellers respond to more price cuts.
Markets in the Midwest and Northeast remain the most active, while the West’s flat pricing could mean slower months ahead. Long-term, the 2026 outlook from NAR, MBA, and Fannie Mae suggests stronger growth ahead – and inspectors who stay visible with agents now will be ready when those volumes return.