A tighter market with steady demand
October’s housing activity reflects a market that remains constrained but steady. Existing home sales totaled 358,000, a +0.8% month-over-month increase and +2.9% year-over-year increase. Year-to-date sales remain essentially flat at +0.1% compared to 2024.
New supply continues to shrink while demand strengthens. 219,618 net new listings hit the market (-9.5% YoY), but 272,257 homes went under contract (+10.4% YoY), according to HouseCanary. That imbalance signals a winter season where fewer listings may meet continued buyer interest.
Prices: stable overall, strongest at the high end
Pricing momentum remains concentrated in higher-value homes. The $600K+ and $1M+ tiers are seeing the fastest growth in both new listings and contracts, while the under $200K segment continues to shrink.
The national median existing home price reached $415,200, a +2.1% YoY increase. Regionally, the Midwest (+4.6%) and Northeast (+6.5%) led price gains. The South and West were nearly flat (<+0.3%).
Prices remain sticky: median listing prices are roughly flat YoY and slightly lower MoM, while closed prices continue to trend upward due to continued competition for limited inventory.
Mortgage rates and longer-term projections
Mortgage rates averaged 6.6% in Q3.
- Fannie Mae projects rates falling to 6.2% by early 2026 and 5.9% by late 2026
- MBA expects the 30-year fixed to remain between 6.4% and 6.35% through 2028
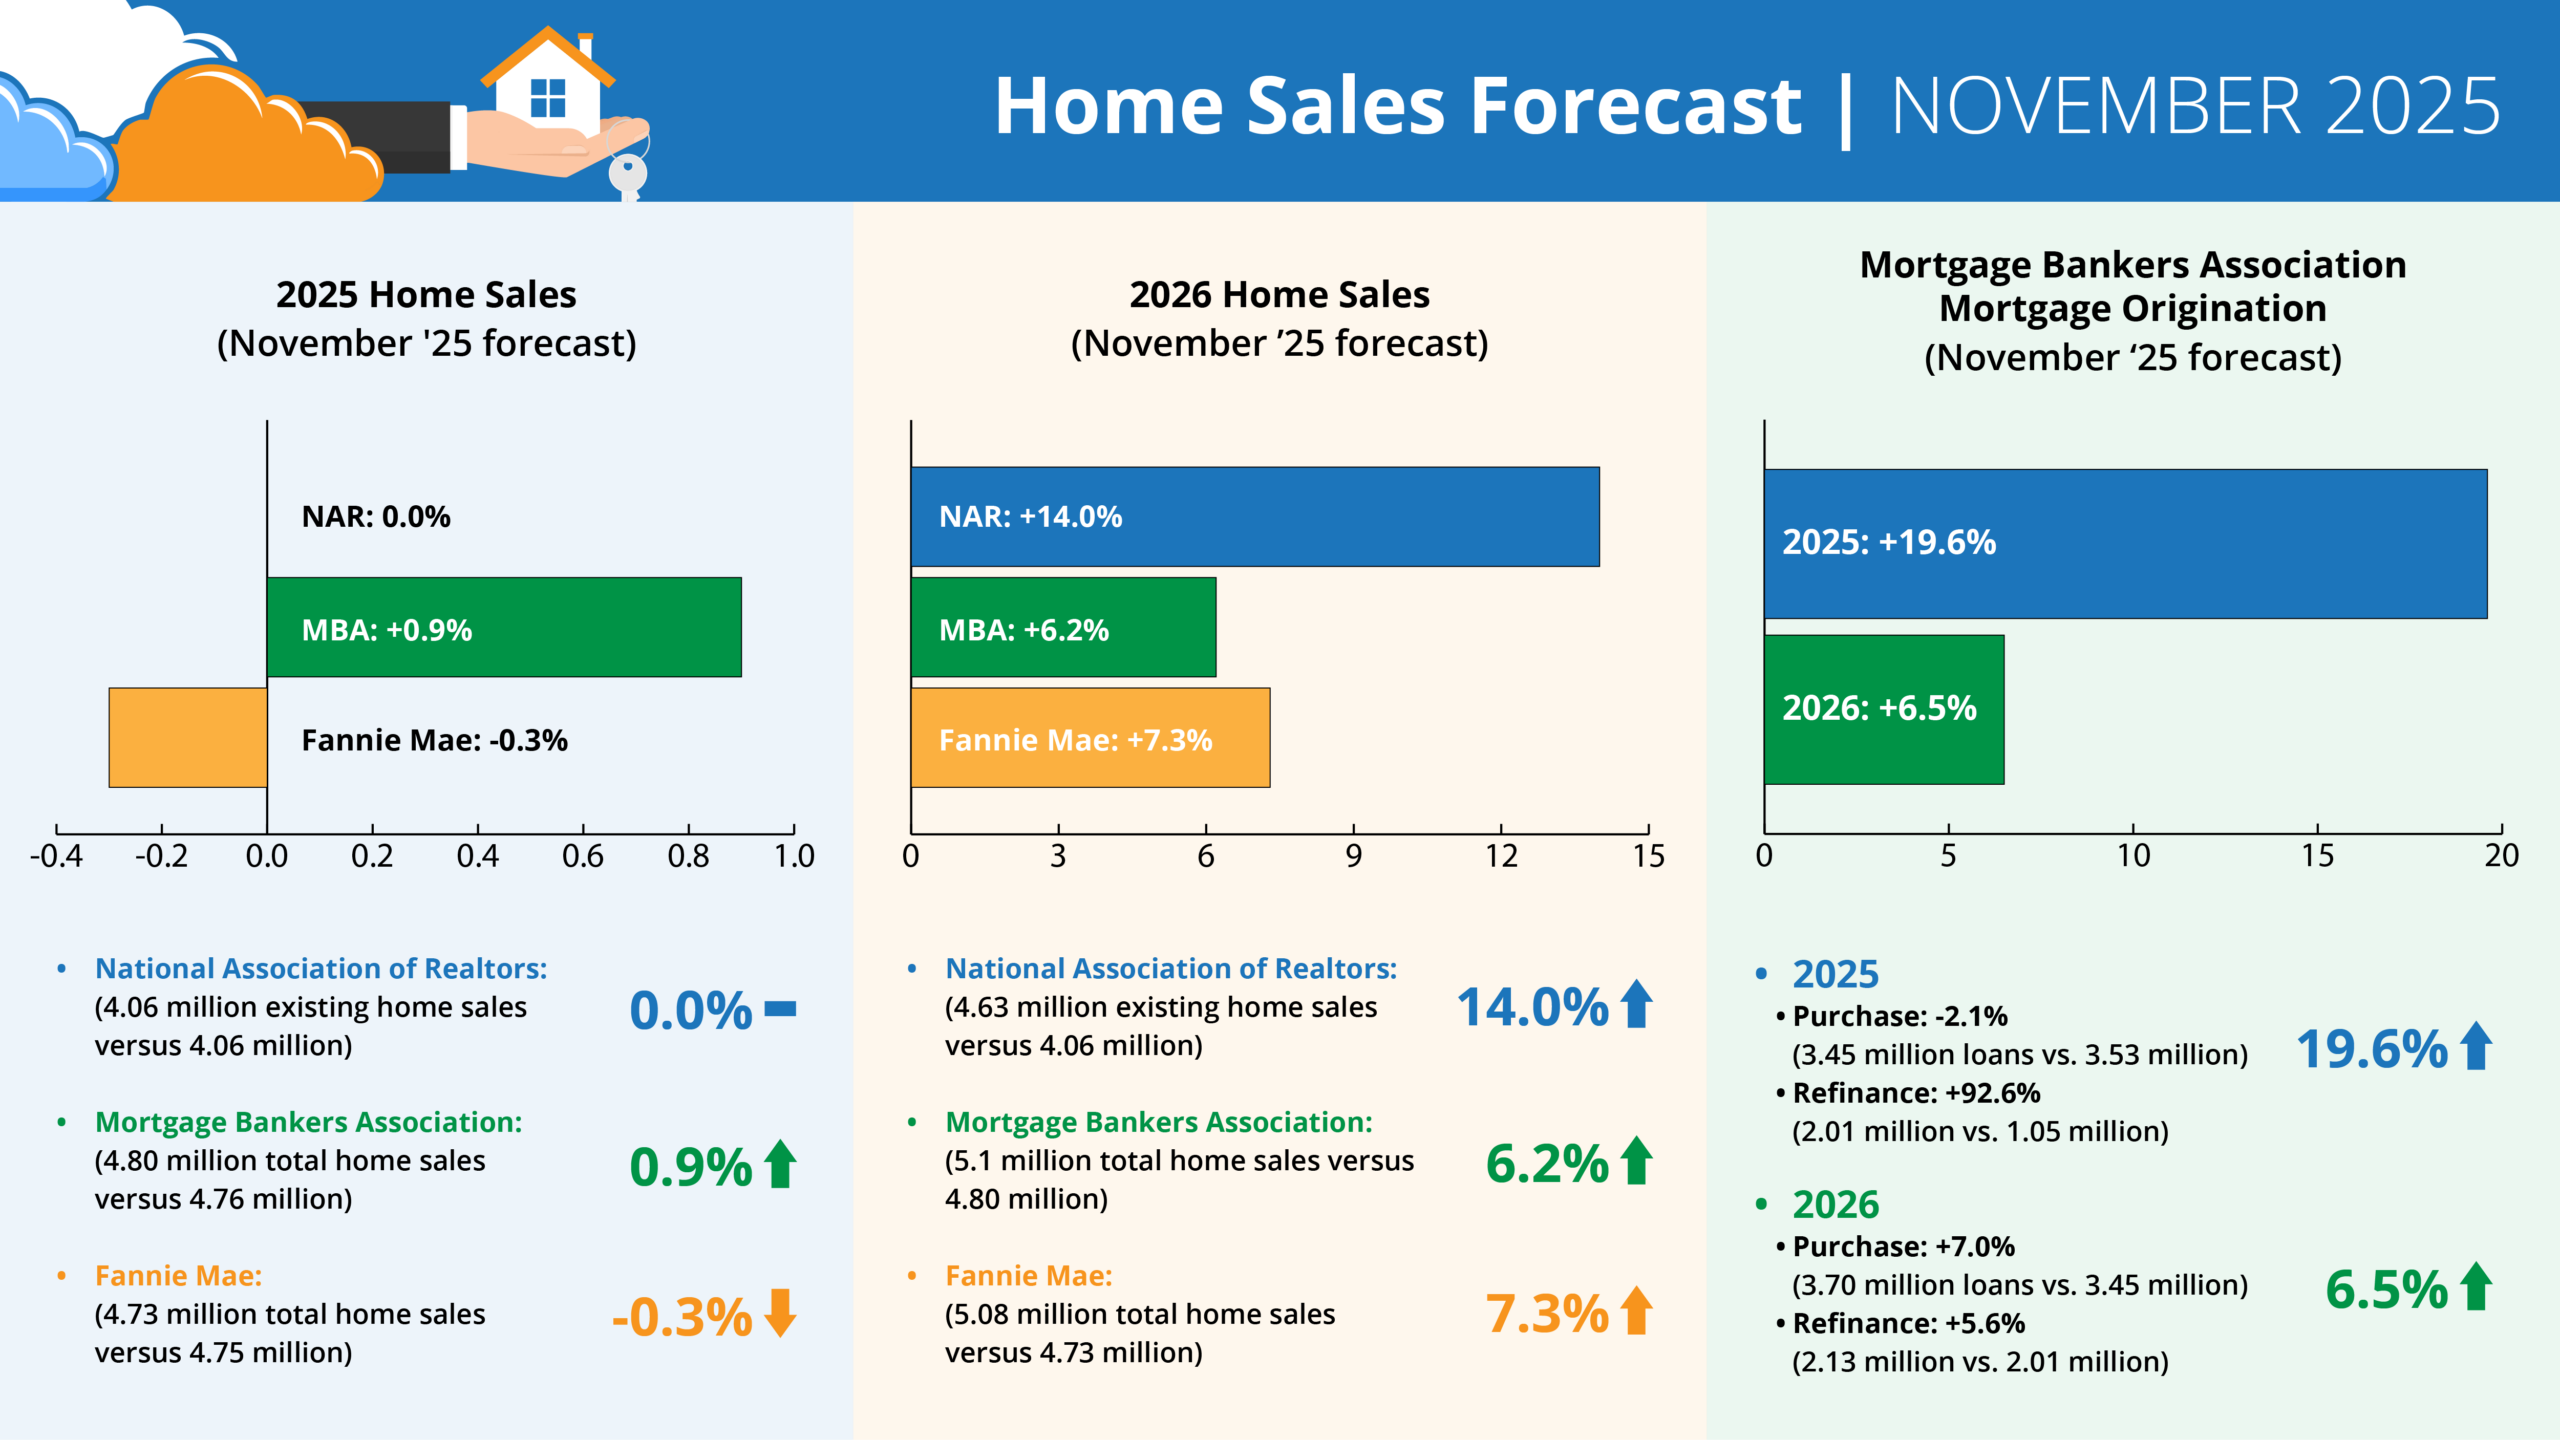
Forecasts for 2025 home sales (November ‘25 forecast)
- NAR: 0.0% (4.06 million existing home sales vs. 4.06 million)
- MBA: +0.9% (4.80 million total home sales vs. 4.76 million)
- Fannie: -0.3% (4.73 million total home sales vs. 4.75 million)
Forecasts for 2026 home sales (November ‘25 forecast)
- NAR: +14.0% (4.63 million existing home sales vs. 4.06 million)
- MBA: +6.2% (5.1 million total home sales vs. 4.8 million)
- Fannie: +7.3% (5.08 million total home sales vs. 4.73 million)
MBA forecast for mortgage originations (November ‘25 forecast)
2025 total mortgage originations: +19.6% (5.47 million loans vs. 4.57 million)
- Purchase: -2.1% (3.45 million loans vs. 3.53 million)
- Refi: +92.6% (2.01 million vs. 1.05 million)
2026 total mortgage originations: +6.5% (5.82 million loans vs. 5.47 million)
- Purchase: +7.0% (3.70 million loans vs. 3.45 million)
- Refi: +5.6% (2.13 million vs. 2.01 million)
What it means for inspectors
For growing inspection businesses, constrained inventory may continue to create urgency among buyers – keeping inspections essential even as rates stay elevated. The Midwest and Northeast may offer more consistent volume this winter, based on pricing momentum.
With 2026 forecasted sales growth across all three agencies, maintaining strong agent relationships now positions inspectors to capitalize as transaction volumes return.