A tighter market, but buyers haven’t stepped away
November wrapped up with fewer closings, but buyer activity didn’t dry up. According to the National Association of Realtors (NAR), existing home sales totaled 293,000 (non-seasonally adjusted), down -18.4% from October and -7.0% year over year. On a year-to-date basis, sales are now down -0.5% compared to 2024.
What stands out is the imbalance between supply and demand. Data from HouseCanary shows net new listings fell -16.2% YoY in November, while 248,109 homes went under contract, up +10.1% YoY. Fewer homes are hitting the market, but buyers are still stepping in when they find the right one.
Prices are steady, with strength at the top
Price movement remains uneven, but stable overall. According to HouseCanary, median single-family listing prices dipped slightly (-0.3% YoY), while median closed prices increased +3.4%. That gap suggests competition is still present, especially for well-priced homes.
The national median existing home price came in at $409,200, a +1.2% YoY increase according to the Mortgage Bankers Association (MBA). The Midwest led with +5.8% growth, while the Northeast (+1.1%) and South (+0.8%) saw modest gains. Prices in the West declined slightly (-0.9%).
Mortgage rates and what’s ahead
The MBA also reports that mortgage rates averaged 6.6% in Q3 2025, with modest relief expected ahead. Projections from Fannie Mae call for rates ending 2025 around 6.2%, with further easing into 2026. Longer-term forecasts expect rates to hold in the low-to-mid 6% range.
As rates ease, refinance activity is expected to stay active, even as purchase volume remains tied to inventory.
Current forecasts
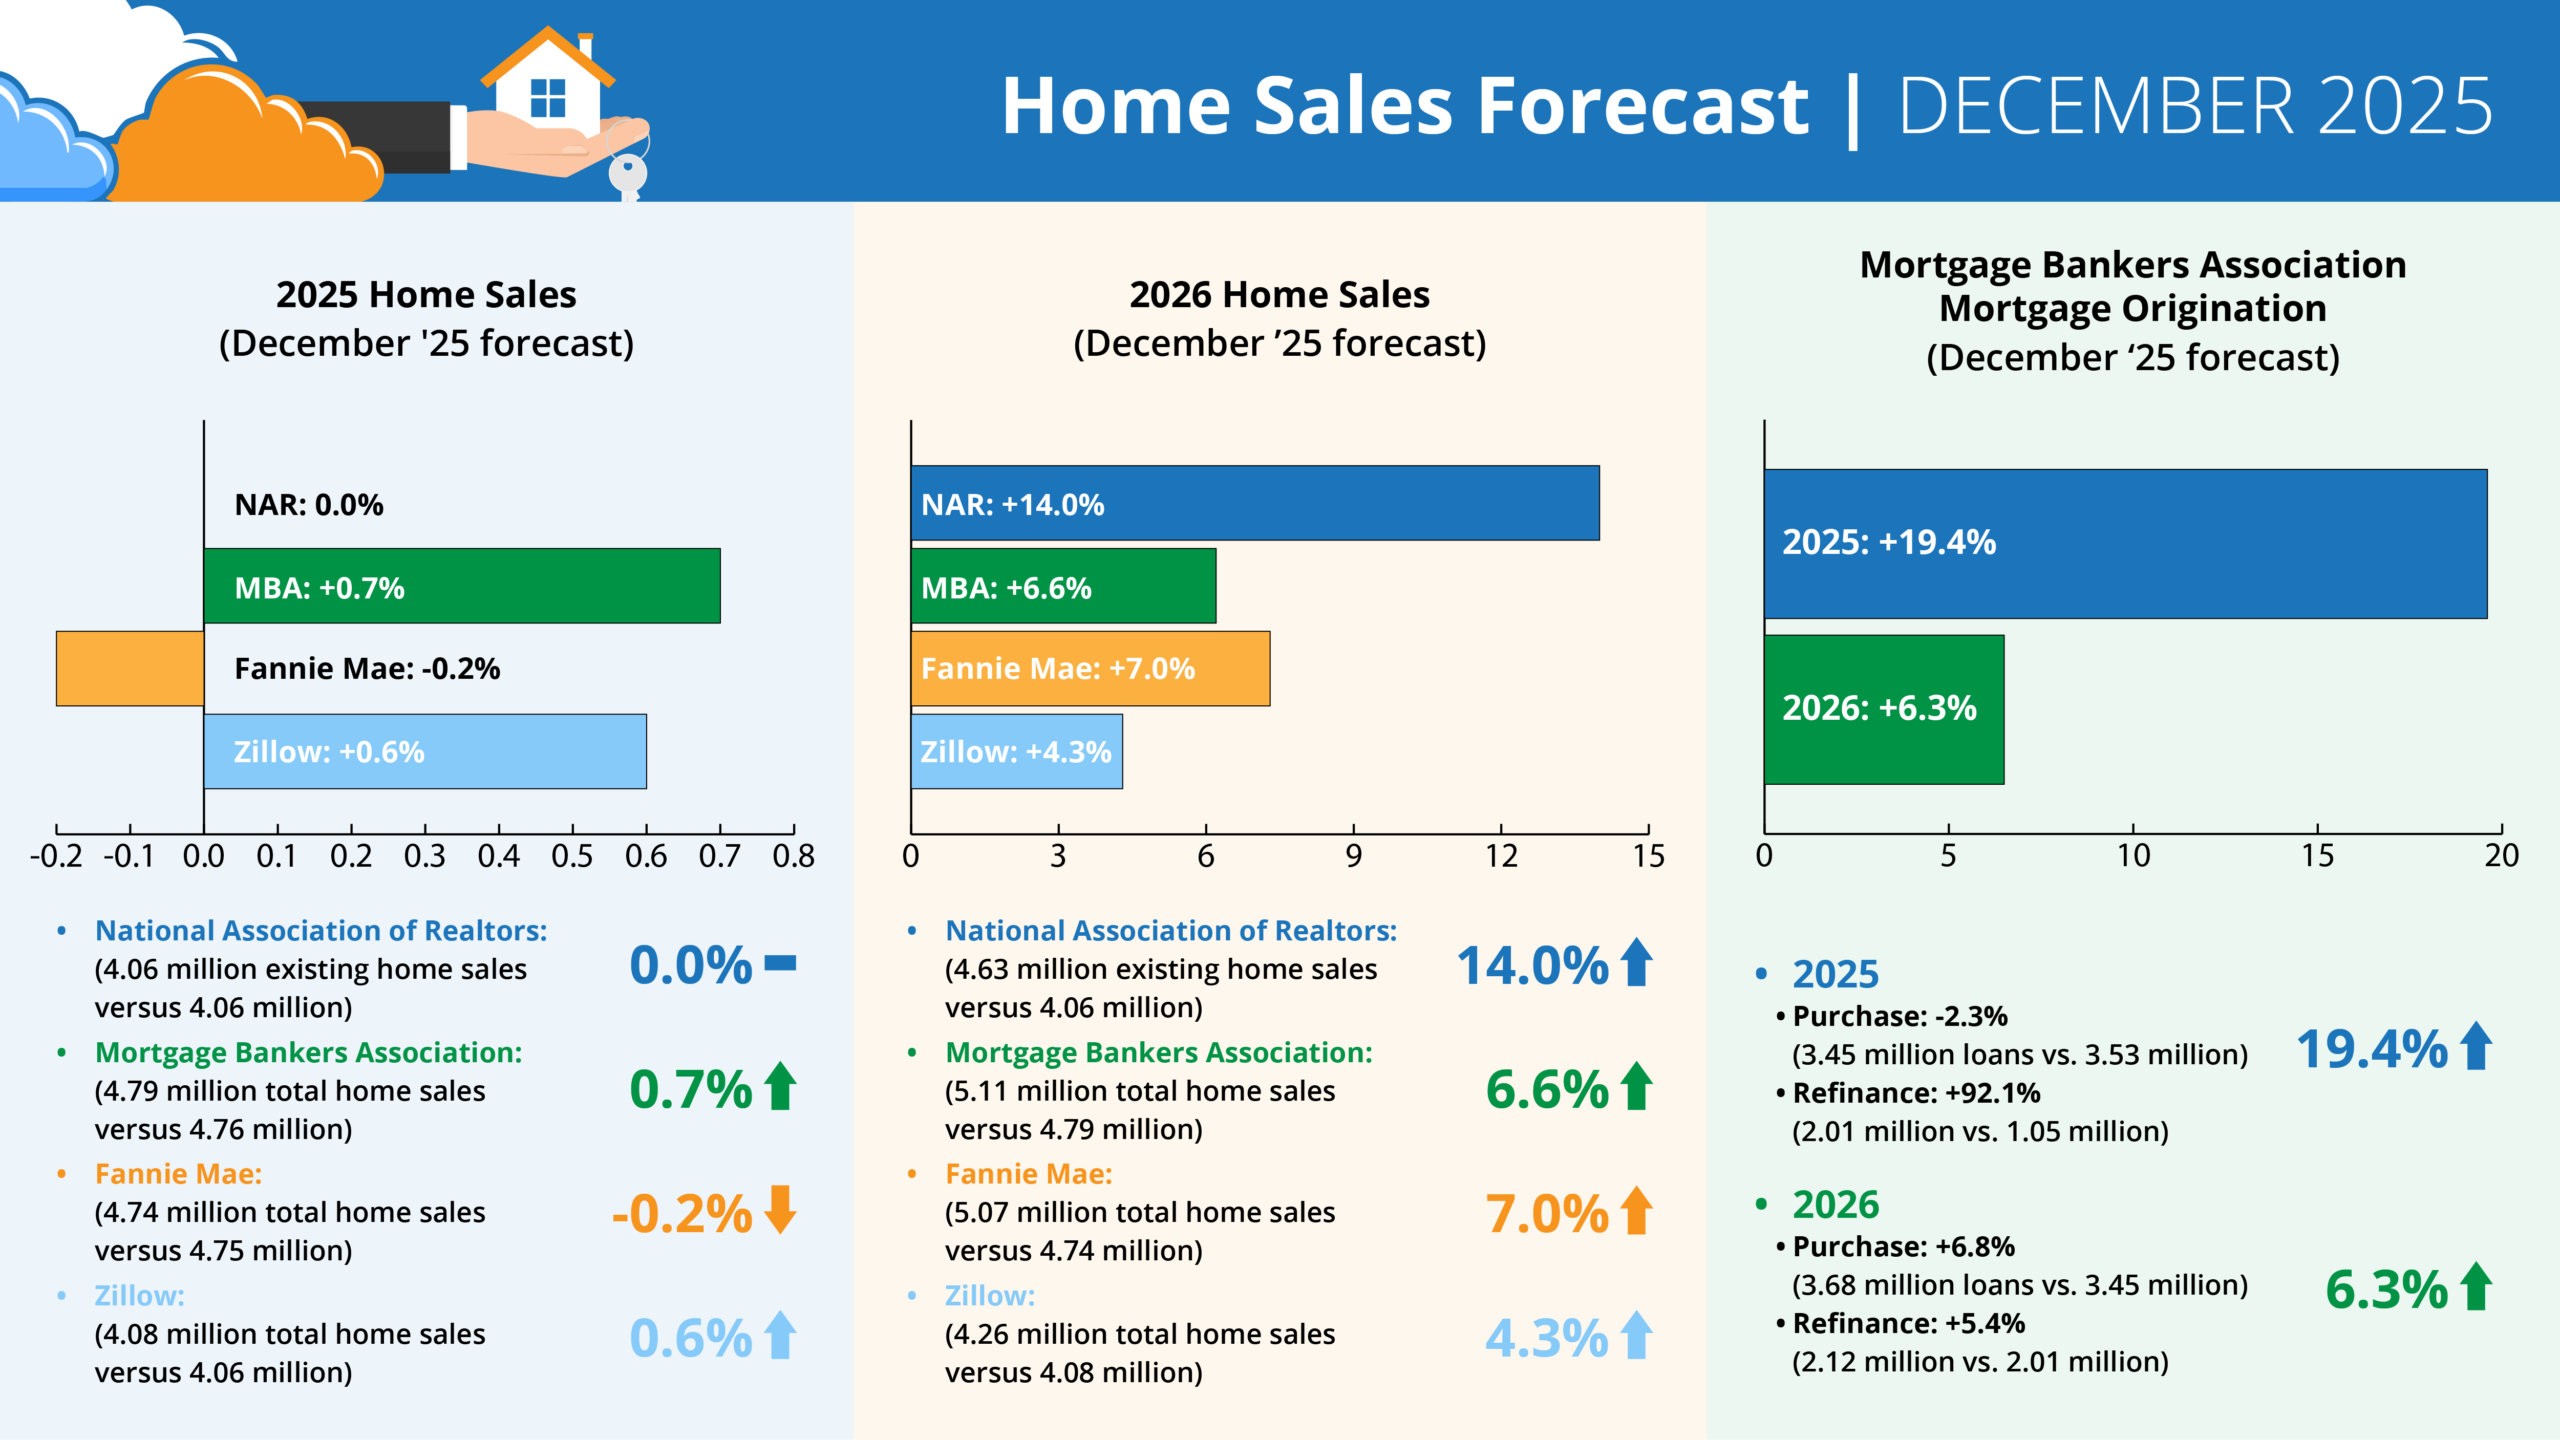
Forecasts for 2025 home sales (December ‘25 forecast)
- NAR: 0.0% (4.06 million existing home sales vs. 4.06 million)
- MBA: +0.7% (4.79 million total home sales vs. 4.76 million)
- Fannie Mae: -0.2% (4.74 million total home sales vs. 4.75 million)
- Zillow: +0.6% (4.08 million existing home sales vs. 4.06 million)
Forecasts for 2026 home sales (December ‘25 forecast)
- NAR: +14.0% (4.63 million existing home sales vs. 4.06 million)
- MBA: +6.6% (5.11 million total home sales vs. 4.79 million)
- Fannie Mae: +7.0% (5.07 million total home sales vs. 4.74 million)
- Zillow: +4.3% (4.26 million existing home sales vs. 4.08 million)
MBA forecast for mortgage originations (December ‘25 forecast)
2025 total mortgage originations: +19.4% (5.46 million loans vs. 4.57 million)
- Purchase: -2.3% (3.45 million loans vs. 3.53 million)
- Refi: +92.1% (2.01 million vs. 1.05 million)
2026 total mortgage originations: +6.3% (5.80 million loans vs. 5.46 million)
- Purchase: +6.8% (3.68 million loans vs. 3.45 million)
- Refi: +5.4% (2.12 million vs. 2.01 million)
What it means for inspection businesses
For growing inspection companies, November reinforces what the last several months have shown: fewer listings don’t eliminate inspections. They often increase urgency around the homes that do come to market.
With all major forecasts pointing to higher transaction volume in 2026, staying operationally ready now puts inspection businesses in a stronger position when activity picks back up.