
In today’s economy, workers can earn dramatically different pay for the same work depending on where they live. Blue-collar workers typically perform manual labor, with some of the most popular jobs in agriculture, manufacturing, construction, and other sectors. Some cities are known as “blue-collar cities,” which include a high concentration of folks who work in these positions. Not all the cities on our list are blue-collar cities, but they are areas where you can make the most in those types of jobs relative to the cost of living.
Here are the top cities with the most successful blue-collar workers. Read on for the rest of the list and to learn how much they earn.
- Pittsburgh, PA. Share of all workers in blue-collar jobs: 31.5%
- Buffalo-Cheektowaga, NY. Share of all workers in blue-collar jobs: 32.8%
- Hartford-East Hartford-Middletown, CT. Share of all workers in blue-collar jobs: 26.6%
After losing jobs in December and beginning the new year with only a meager increase in employment, the U.S. added 916,000 jobs in March, according to the Bureau of Labor Statistics (BLS). BLS data shows that some blue-collar industries have more than rebounded from last spring—employment in residential construction, the courier and messenger industry, and warehousing and storage have now surpassed pre-pandemic levels. As demand for some blue-collar jobs increases, employers are offering higher wages to attract workers. The latest Census Bureau data shows that the median annual wage for blue-collar workers is $40,000, but blue-collar wages vary significantly across the country and by occupation.
What are blue-collar jobs?
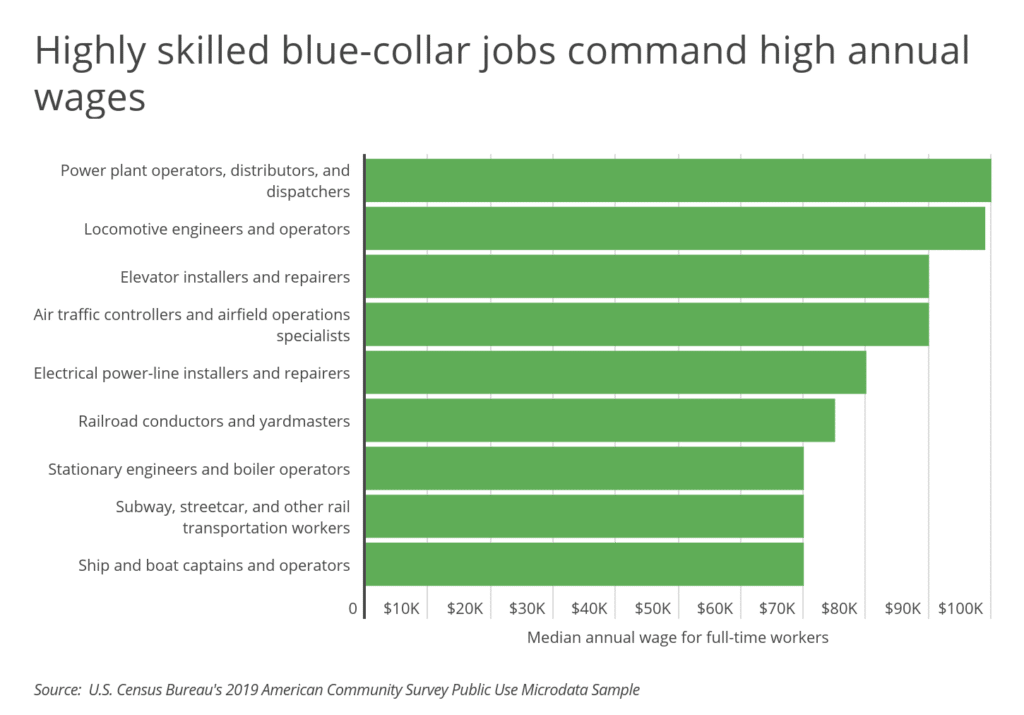
Blue-collar jobs are those that involve manual labor and are often paid on an hourly basis, although some are salaried. Blue-collar jobs can be skilled or unskilled. Some blue-collar occupations that require a high degree of skill command high annual wages, even topping six figures. Among all blue-collar occupations, power plant operators, distributors, and dispatchers have the highest median annual wage, at $100,000. Locomotive engineers and operators earn nearly as much with a median annual wage of $99,000. At the opposite end of the spectrum, jobs requiring lower levels of training and skill, such as taxi drivers and chauffeurs, receive the lowest wages.
Where do blue-collar workers live?
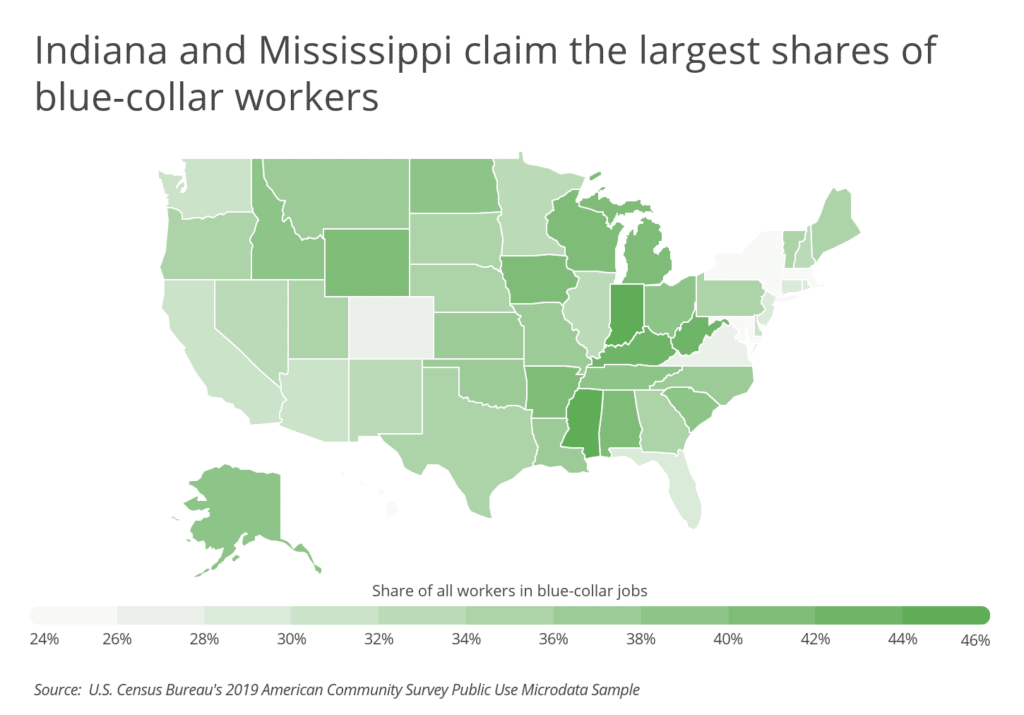
The proportion of workers in blue-collar jobs ranges across the U.S. due to differences in local industry composition. At the state level, Indiana and Mississippi—where manufacturing and mining are some of the top industries—have the largest share of blue-collar workers at 45% and 44% of total employment, respectively. Maryland, on the other hand, which is known for having high concentrations of healthcare, government, and professional service jobs, has the smallest share of blue-collar workers in the U.S at 25%.
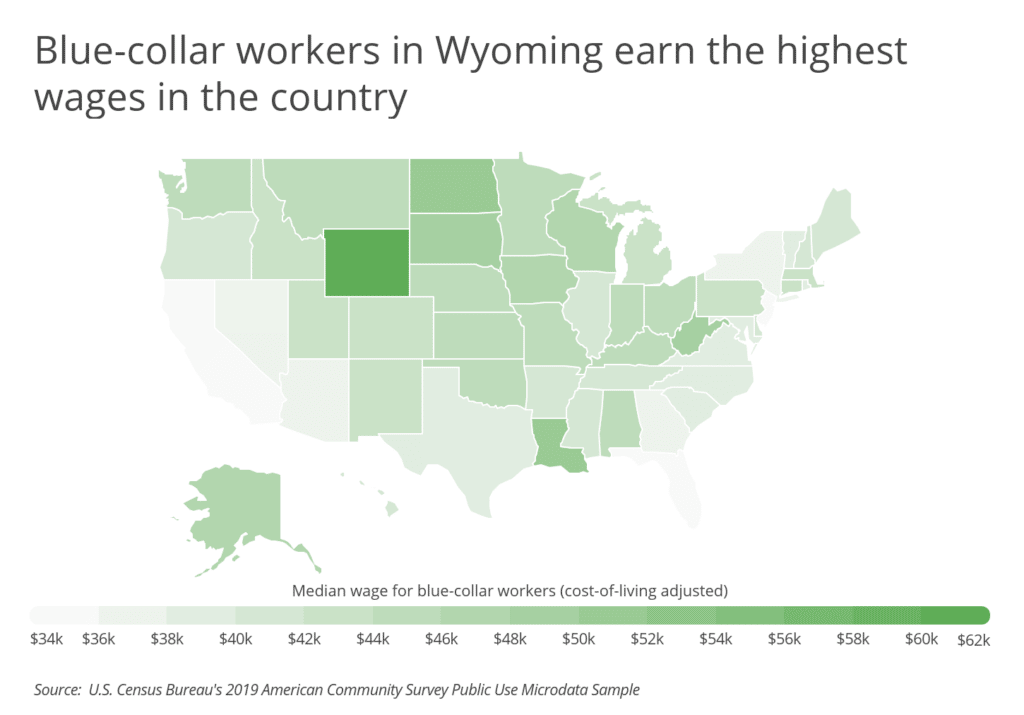
Regarding pay, locations with high concentrations of skilled blue-collar occupations tend to report higher nominal blue-collar wages, but wages in locations with lower living costs may also be higher in real terms. Blue-collar workers in Wyoming and Louisiana have the highest median wages, after adjusting for cost of living, at $62,500 and $51,195, respectively. California’s high cost of living means that blue-collar workers’ wages do not go as far; the median cost-of-living-adjusted annual wage of blue-collar workers in California is just $34,364, the lowest in the nation.
To find the metropolitan areas with the most successful blue-collar workers, researchers at the Inspection Support Network analyzed the latest data from the U.S. Census Bureau, the U.S. Bureau of Economic Analysis, and Unionstats.com. The researchers ranked metro areas according to the cost-of-living-adjusted median annual wages for full-time blue-collar workers. Researchers also calculated the unadjusted median wage for blue-collar workers, the unadjusted median wage for all workers, the share of all workers in blue-collar jobs, and the union membership rate.
To improve relevance, only metropolitan areas with at least 100,000 people were included in the analysis. Additionally, metro areas were grouped into the following cohorts based on population size:
- Small metros: 100,000–349,999
- Midsize metros: 350,000–999,999
- Large metros: 1,000,000 or more
Here are the metros with the most successful blue-collar workers.
Large Metros With the Most Successful Blue-Collar Workers
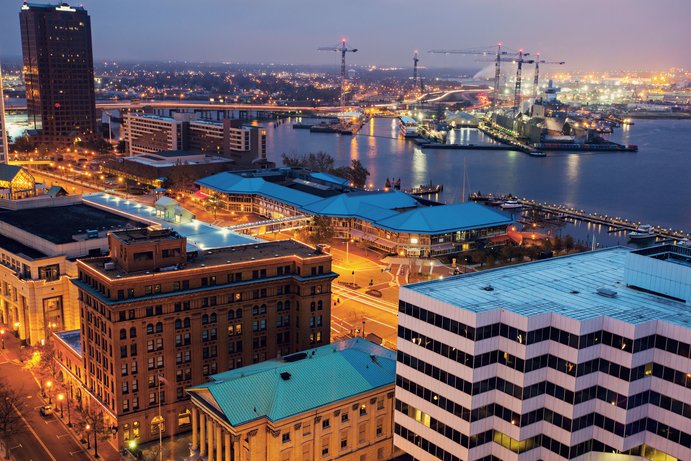
Photo Credit: Alamy Stock Photo
15. Virginia Beach-Norfolk-Newport News, VA-NC
- Median wage for blue-collar workers (adjusted): $43,154
- Median wage for blue-collar workers (unadjusted): $41,600
- Median wage for all workers (unadjusted): $48,000
- Share of all workers in blue-collar jobs: 30.3%
- Union membership rate: 5.6%

Photo Credit: Alamy Stock Photo
14. Denver-Aurora-Lakewood, CO
- Median wage for blue-collar workers (adjusted): $43,186
- Median wage for blue-collar workers (unadjusted): $45,000
- Median wage for all workers (unadjusted): $56,000
- Share of all workers in blue-collar jobs: 24.6%
- Union membership rate: 6.9%

Photo Credit: Alamy Stock Photo
13. Seattle-Tacoma-Bellevue, WA
- Median wage for blue-collar workers (adjusted): $43,668
- Median wage for blue-collar workers (unadjusted): $50,000
- Median wage for all workers (unadjusted): $64,000
- Share of all workers in blue-collar jobs: 27.2%
- Union membership rate: 16.3%

Photo Credit: Alamy Stock Photo
12. Minneapolis-St. Paul-Bloomington, MN-WI
- Median wage for blue-collar workers (adjusted): $43,732
- Median wage for blue-collar workers (unadjusted): $45,000
- Median wage for all workers (unadjusted): $56,000
- Share of all workers in blue-collar jobs: 29.1%
- Union membership rate: 15.4%

Photo Credit: Alamy Stock Photo
11. Indianapolis-Carmel-Anderson, IN
- Median wage for blue-collar workers (adjusted): $43,908
- Median wage for blue-collar workers (unadjusted): $40,000
- Median wage for all workers (unadjusted): $47,000
- Share of all workers in blue-collar jobs: 33.3%
- Union membership rate: 6.2%

Photo Credit: Alamy Stock Photo
10. Detroit-Warren-Dearborn, MI
- Median wage for blue-collar workers (adjusted): $44,071
- Median wage for blue-collar workers (unadjusted): $42,000
- Median wage for all workers (unadjusted): $50,000
- Share of all workers in blue-collar jobs: 36.2%
- Union membership rate: 16.2%

Photo Credit: Alamy Stock Photo
9. Cincinnati, OH-KY-IN
- Median wage for blue-collar workers (adjusted): $44,150
- Median wage for blue-collar workers (unadjusted): $40,000
- Median wage for all workers (unadjusted): $50,000
- Share of all workers in blue-collar jobs: 33.6%
- Union membership rate: 11.0%
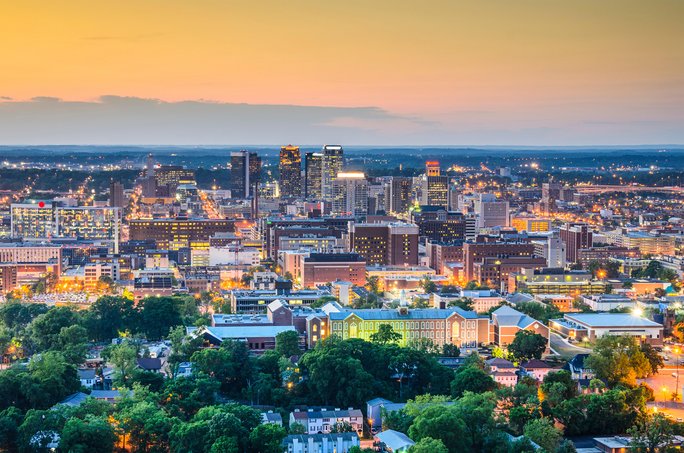
Photo Credit: Alamy Stock Photo
8. Birmingham-Hoover, AL
- Median wage for blue-collar workers (adjusted): $44,168
- Median wage for blue-collar workers (unadjusted): $39,000
- Median wage for all workers (unadjusted): $45,000
- Share of all workers in blue-collar jobs: 34.2%
- Union membership rate: 10.0%

Photo Credit: Alamy Stock Photo
7. Cleveland-Elyria, OH
- Median wage for blue-collar workers (adjusted): $44,494
- Median wage for blue-collar workers (unadjusted): $40,000
- Median wage for all workers (unadjusted): $48,000
- Share of all workers in blue-collar jobs: 33.4%
- Union membership rate: 12.6%

Photo Credit: Alamy Stock Photo
6. Oklahoma City, OK
- Median wage for blue-collar workers (adjusted): $44,543
- Median wage for blue-collar workers (unadjusted): $40,000
- Median wage for all workers (unadjusted): $44,600
- Share of all workers in blue-collar jobs: 31.9%
- Union membership rate: 6.9%

Photo Credit: Alamy Stock Photo
5. Providence-Warwick, RI-MA
- Median wage for blue-collar workers (adjusted): $44,865
- Median wage for blue-collar workers (unadjusted): $45,000
- Median wage for all workers (unadjusted): $50,000
- Share of all workers in blue-collar jobs: 32.3%
- Union membership rate: 18.4%
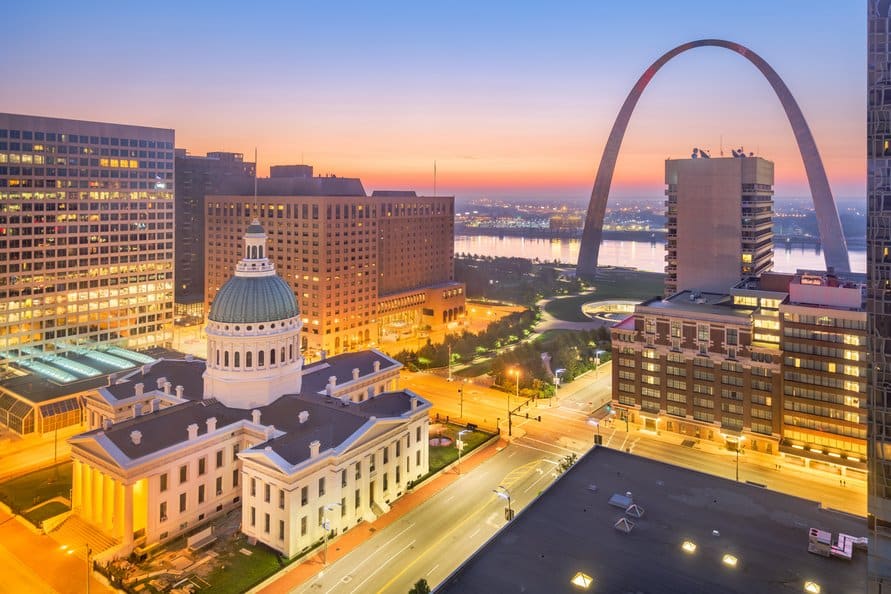
Photo Credit: Alamy Stock Photo
4. St. Louis, MO-IL
- Median wage for blue-collar workers (adjusted): $46,615
- Median wage for blue-collar workers (unadjusted): $42,000
- Median wage for all workers (unadjusted): $50,000
- Share of all workers in blue-collar jobs: 32.0%
- Union membership rate: 12.5%

Photo Credit: Alamy Stock Photo
3. Hartford-East Hartford-Middletown, CT
- Median wage for blue-collar workers (adjusted): $46,829
- Median wage for blue-collar workers (unadjusted): $48,000
- Median wage for all workers (unadjusted): $60,000
- Share of all workers in blue-collar jobs: 26.6%
- Union membership rate: 17.6%
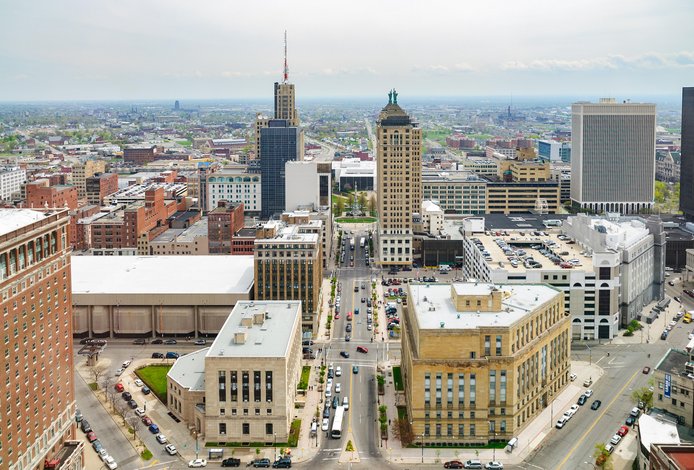
Photo Credit: Alamy Stock Photo
2. Buffalo-Cheektowaga, NY
- Median wage for blue-collar workers (adjusted): $47,619
- Median wage for blue-collar workers (unadjusted): $45,000
- Median wage for all workers (unadjusted): $49,000
- Share of all workers in blue-collar jobs: 32.8%
- Union membership rate: 20.3%

Photo Credit: Alamy Stock Photo
1. Pittsburgh, PA
- Median wage for blue-collar workers (adjusted): $48,701
- Median wage for blue-collar workers (unadjusted): $45,000
- Median wage for all workers (unadjusted): $50,000
- Share of all workers in blue-collar jobs: 31.5%
- Union membership rate: 13.4%
Detailed Findings & Methodology
The metros with the most successful blue-collar workers are scattered across the country and include mostly Midwestern, Rust Belt, and Southern cities. The Pittsburgh metro claims the top spot after adjusting for cost of living, with a median blue-collar adjusted wage of nearly $49,000. Even still, blue-collar wages are lower here than for all workers. While most of the top 15 large metros with the highest blue-collar wages are relatively affordable, a few more expensive metros—including Denver and Seattle—also make the list. Blue-collar workers earn enough in these metros to make up for the cost of living.
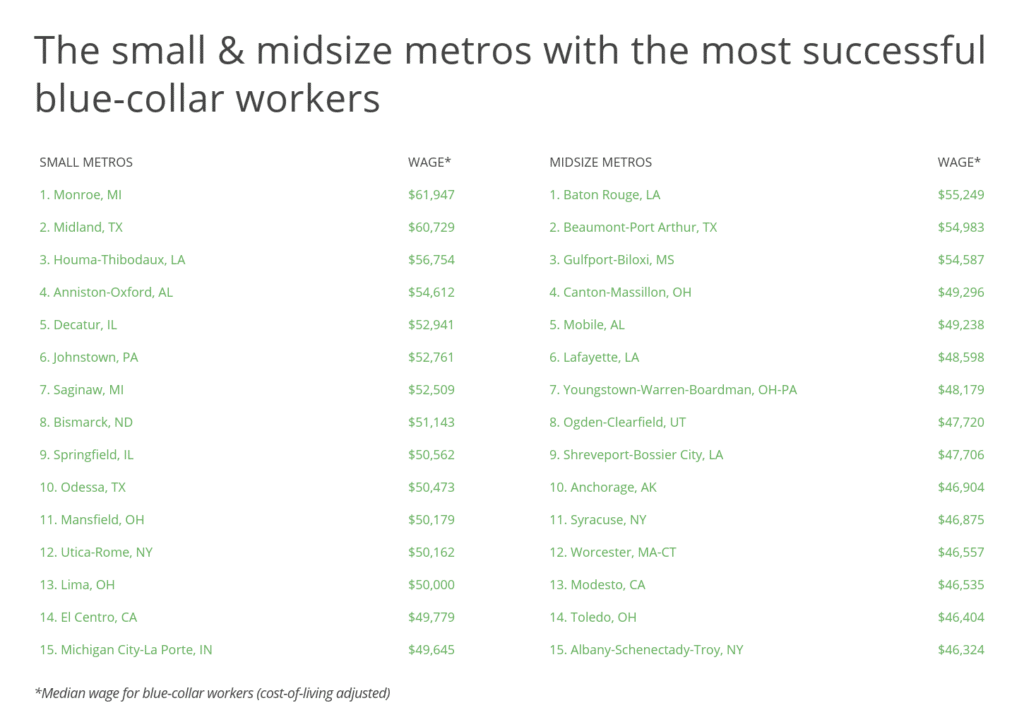
The small and midsize metros with the most successful blue-collar workers are also mostly located in the Midwest, Rust Belt, and South. Some of these metros—Monroe, MI and Johnstown, PA—have very high concentrations of blue-collar workers, topping 50% of total employment. Most of these smaller metros are highly affordable, so blue-collar wages go further. Union membership among these metros ranges considerably, from 0% to over 20%.
To find the locations with the most successful blue-collar workers, researchers at Inspection Support Network analyzed the latest data on wages and employment from the U.S. Census Bureau’s 2019 American Community Survey Public Use Microdata Sample, cost-of-living data from the U.S. Bureau of Economic Analysis’s 2019 Regional Price Parity dataset, and union membership data from Unionstats.com. To make wages comparable across locations, wages in expensive metros were adjusted down to reflect lower purchasing power while wages in relatively affordable metros were adjusted up to reflect higher purchasing power.
The researchers ranked metro areas according to the cost-of-living-adjusted median annual wage for full-time blue-collar workers. In the event of a tie, the metro with the larger share of blue-collar workers was ranked higher. Researchers also calculated the unadjusted median annual wage for blue-collar workers, the unadjusted median annual wage for all full-time workers, the share of all workers in blue-collar jobs, and the union membership rate. Blue-collar workers were defined using Census 2010 occupation code categories: construction and extraction; installation, maintenance, and repair; production; and transportation and material moving.
To improve relevance, only metropolitan areas with at least 100,000 people were included in the analysis. Additionally, metro areas were grouped into the following cohorts based on population size:
- Small metros: 100,000–349,999
- Midsize metros: 350,000–999,999
- Large metros: 1,000,000 or more