
Housing prices in the U.S. have reached record levels during the COVID-19 pandemic and show little sign of slowing down. A combination of strong demand, low inventory of existing homes, and constraints on new construction due to labor and supply shortages have sent prices sharply upward, with the median home sales price in the U.S. recently topping $350,000 for the first time.
While appreciation in home values can be good for homeowners in building equity, price increases can put homeownership out of reach for low and middle income households. And even those who are able to buy may end up in a position of spending more than they can afford. Mortgage lenders evaluate factors like household income and debt-to-income ratio before approving a loan. However, even with such measures in place, a household may struggle to make regular payments and keep up with other expenses, especially if they experience a sudden change like job loss.
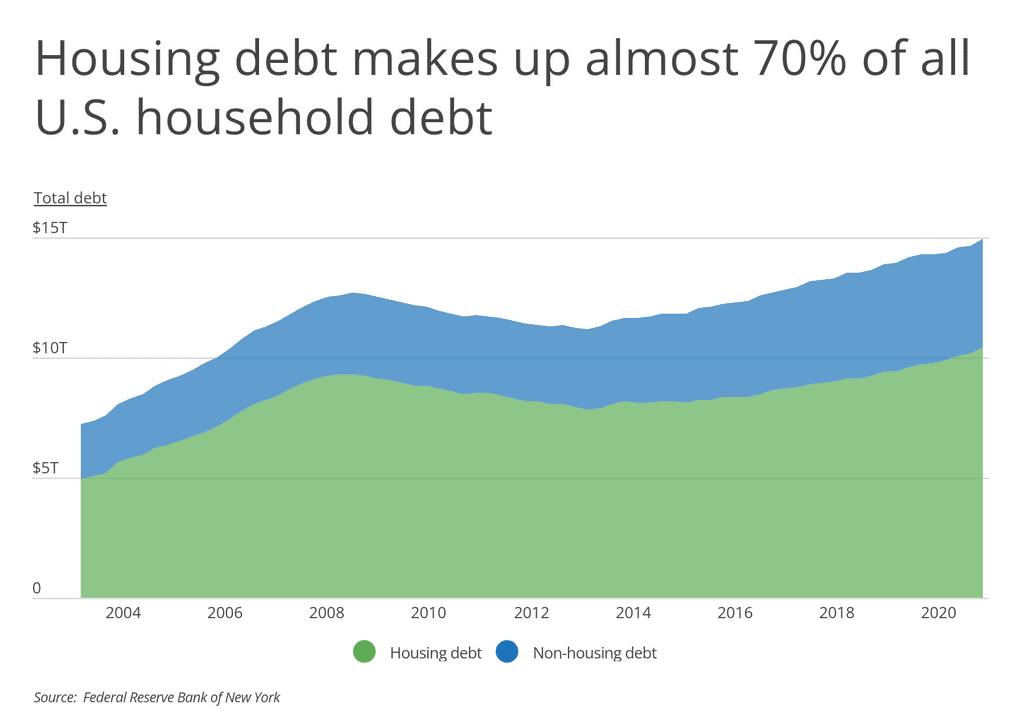
The risks to overleveraged homeowners can be great because housing is the most expensive consumer spending category for most U.S. residents and also the largest source of household debt in the U.S. Housing debt currently totals more than $10 trillion, accounting for nearly 70% of the US. total. If rising home prices push mortgage payments and other associated costs beyond a homeowner’s means, that household could find itself at risk of default. Because so much capital is tied up in housing debt, widespread difficulties with housing costs can also put the larger economy at risk, as the collapse of the housing bubble and Great Recession proved in the mid- to late-2000s.
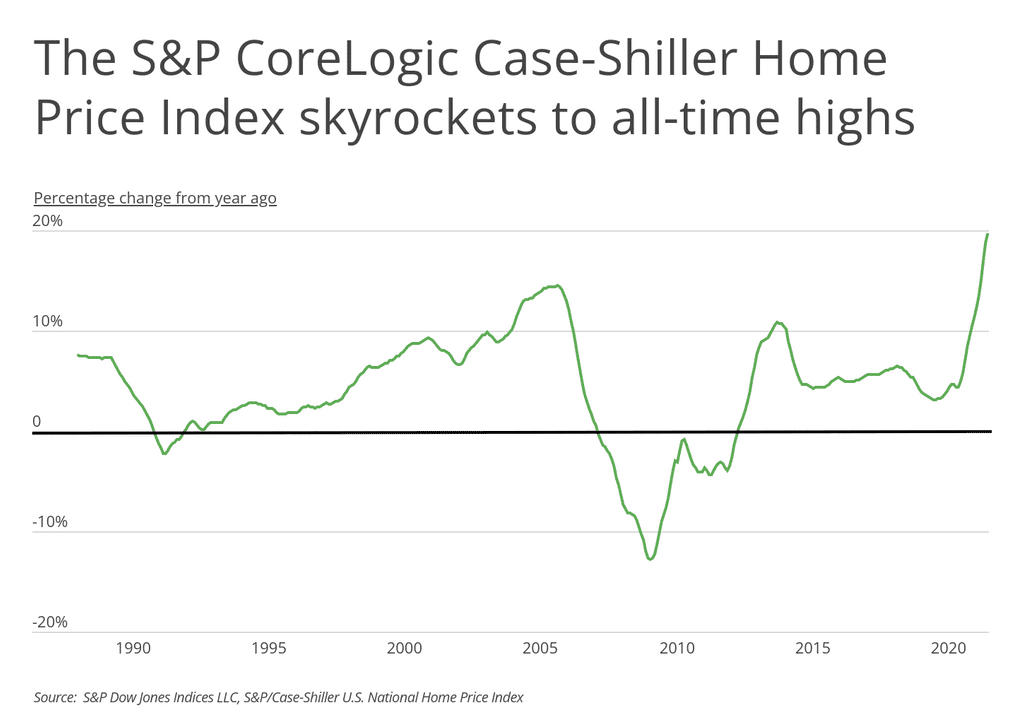
Current economic conditions are different than they were during the last housing boom, but the dramatic spikes in housing prices have led to some concern that the current market constitutes a bubble. One common metric used to track housing prices is the S&P CoreLogic Case-Shiller Home Price Index, which evaluates the year-to-year change in prices for single-family housing based on trends in a selection of metro areas across the U.S. Throughout 2021, the year-over year increase has exceeded 10%. This rapid growth could suggest that homes are becoming overvalued, with homeowners paying more than their asset is worth.
Mortgage debt-to-income ratio is one measure that can be used to evaluate whether homeowners in a particular area are overleveraged. For the purpose of this analysis, the ratio is calculated as the median total outstanding mortgage debt divided by the median household income. When the ratio is higher, the area is considered to be more overleveraged, and when the ratio is lower, the area is less overleveraged. Currently, the most overleveraged areas are those with high housing prices, including multiple cities in California and other high cost areas like New York and Boston. But as housing prices rise nationwide, more cities may find themselves with a larger population of overleveraged homeowners.
To determine the locations with the most overleveraged homeowners, researchers at Inspection Support Network calculated the mortgage debt-to-income ratio for metropolitan areas using the most recent data from the U.S. Census Bureau’s American Housing Survey. In the event of a tie, the location with the higher median total outstanding mortgage debt was ranked higher. Only select metropolitan areas and states with data available from the American Housing Survey were considered in the analysis.
Here are the metros with the most overleveraged homeowners.
Large Metros With the Most Overleveraged Homeowners

10. Washington-Arlington-Alexandria, DC-VA-MD-WV
- Mortgage debt-to-income ratio: 262%
- Total outstanding mortgage debt: $261,500
- Median household income: $100,000
- Mortgage debt as a percent of value: 64%

9. Boston-Cambridge-Newton, MA-NH
- Mortgage debt-to-income ratio: 264%
- Total outstanding mortgage debt: $230,000
- Median household income: $87,000
- Mortgage debt as a percent of value: 48%

8. Portland-Vancouver-Hillsboro, OR-WA
- Mortgage debt-to-income ratio: 268%
- Total outstanding mortgage debt: $202,000
- Median household income: $75,300
- Mortgage debt as a percent of value: 49%

7. Seattle-Tacoma-Bellevue, WA
- Mortgage debt-to-income ratio: 278%
- Total outstanding mortgage debt: $250,000
- Median household income: $90,000
- Mortgage debt as a percent of value: 50%

6. Phoenix-Mesa-Scottsdale, AZ
- Mortgage debt-to-income ratio: 280%
- Total outstanding mortgage debt: $179,000
- Median household income: $64,000
- Mortgage debt as a percent of value: 61%

5. Miami-Fort Lauderdale-West Palm Beach, FL
- Mortgage debt-to-income ratio: 290%
- Total outstanding mortgage debt: $158,000
- Median household income: $54,400
- Mortgage debt as a percent of value: 52%

4. Riverside-San Bernardino-Ontario, CA
- Mortgage debt-to-income ratio: 306%
- Total outstanding mortgage debt: $201,000
- Median household income: $65,600
- Mortgage debt as a percent of value: 56%

3. New York-Newark-Jersey City, NY-NJ-PA
- Mortgage debt-to-income ratio: 314%
- Total outstanding mortgage debt: $220,000
- Median household income: $70,000
- Mortgage debt as a percent of value: 53%

7. San Francisco-Oakland-Hayward, CA
- Mortgage debt-to-income ratio: 344%
- Total outstanding mortgage debt: $365,000
- Median household income: $106,000
- Mortgage debt as a percent of value: 37%

1. Los Angeles-Long Beach-Anaheim, CA
- Mortgage debt-to-income ratio: 400%
- Total outstanding mortgage debt: $300,000
- Median household income: $75,000
- Mortgage debt as a percent of value: 44%
Detailed Findings & Methodology
The data used in this analysis is from the U.S. Census Bureau’s American Housing Survey for the year 2019, the most recent data available. To determine the locations with the most overleveraged homeowners, researchers calculated the mortgage debt-to-income ratio using median total outstanding mortgage debt and median household income. In the event of a tie, the location with the higher median total outstanding mortgage debt was ranked higher. Only metropolitan areas and states with data available from the American Housing Survey were considered in the analysis.