If there’s one word that describes the U.S. housing market, it’s unpredictable. The COVID-19 pandemic introduced an unprecedented economic shift, and with it, a rise and fall in home sales.
Cities with the most homes for sale:
- Miami-Fort Lauderdale-Pompano Beach, FL – Number of active listings per 10k homes: 337
- Atlanta-Sandy Springs-Alpharetta, GA – Number of active listings per 10k homes: 219
- New York-Newark-Jersey City, NY-NJ-PA – Number of active listings per 10k homes: 190
Cities with the fewest homes for sale:
- Buffalo-Cheektowaga, NY – Number of active listings per 10k homes: 39
- San Jose-Sunnyvale-Santa Clara, CA – Number of active listings per 10k homes: 41
- Columbus, OH – Number of active listings per 10k homes: 41
The onset of the COVID-19 pandemic in the late winter and early spring of last year set off a series of whiplashing shifts. Initially, public health concerns and stay-at-home orders brought the market to a halt as buyers and sellers alike held back on transactions. But over the course of the year, demand rebounded in dramatic fashion. Increased household savings gave many people more resources to enter the market, especially among first-time buyers in the millennial generation. Meanwhile, space and amenities in the home took on additional value because more people were working and schooling from home. All of these factors have driven up the demand for homes.
Despite strong interest from buyers, the market has not seen supply keep up. The ripple effects of the pandemic have made many would-be sellers more conservative, keeping their homes off the market. With the broader economic outlook still uncertain in many ways, these homeowners are wary of making such a major transaction, especially when it means competing with a mass of buyers for their next property.
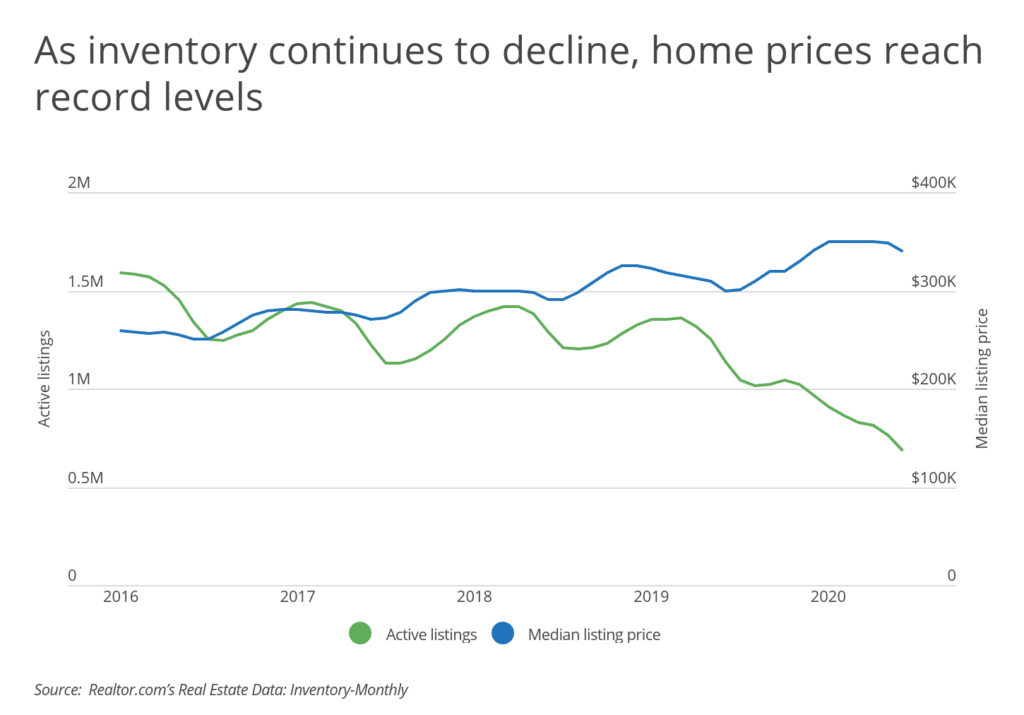
Together, the combination of strong demand and weak supply has produced higher prices and lower inventory. In a typical year, the number of active listings and the median list price for homes stay roughly in sync, following the seasonality of the real estate market. In 2020, however, there was a divergence as prices continued to increase while active listings fell sharply over the course of the year.
Supply vs. demand
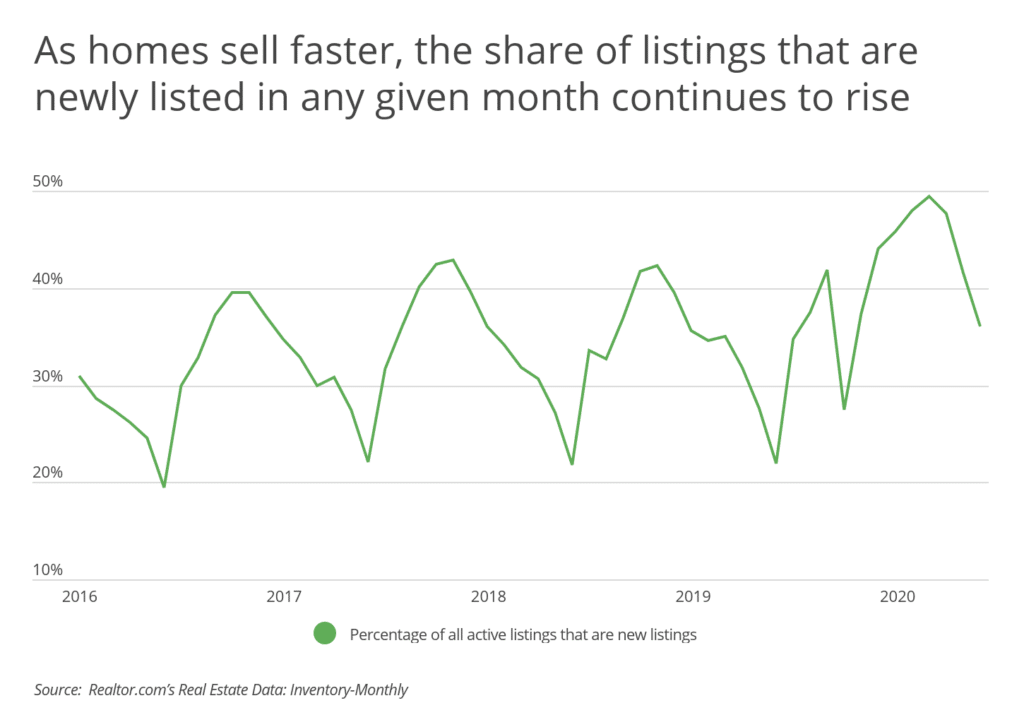
Another side effect of this dynamic is that the homes that do come on the market sell faster because of the scarcity. In turn, this means that the share of listings on the market that are new in any given month is rising. At the peak of the summer market in 2020, the share of listings that were newly listed within the past 30 days was almost half of total inventory. Even for the slower periods in November and December 2020, the share of new listings was up 50 percent or more year-over-year for the same months—and comparable to the level for peak months in a normal year.
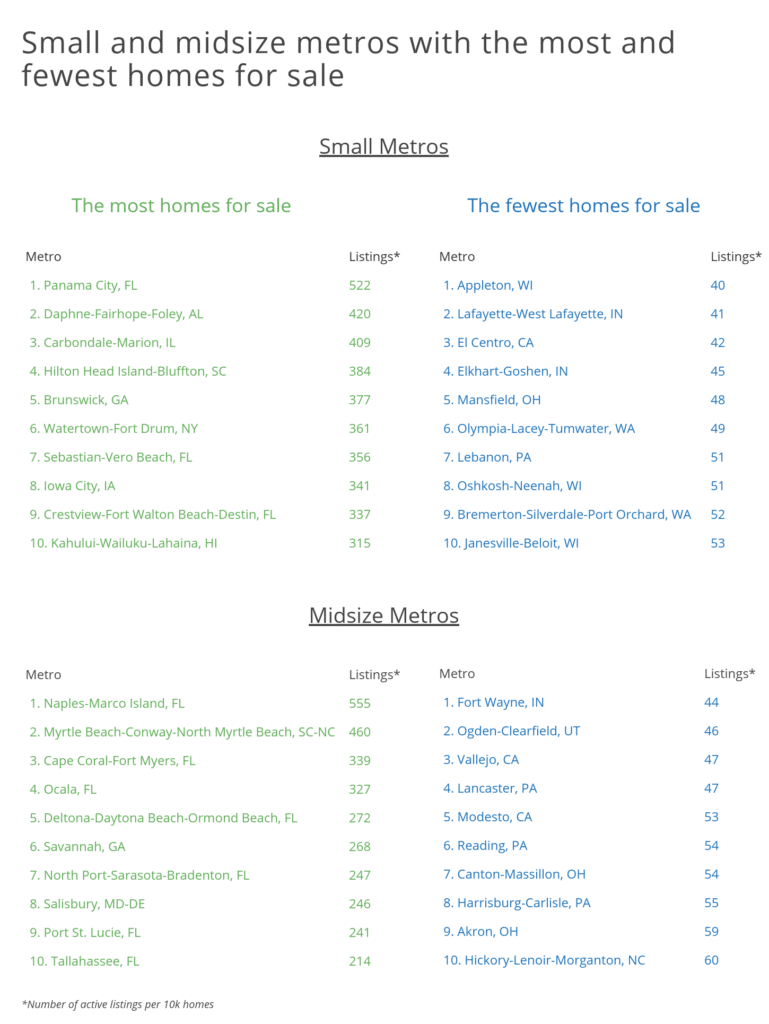
Where are there the most houses for sale?
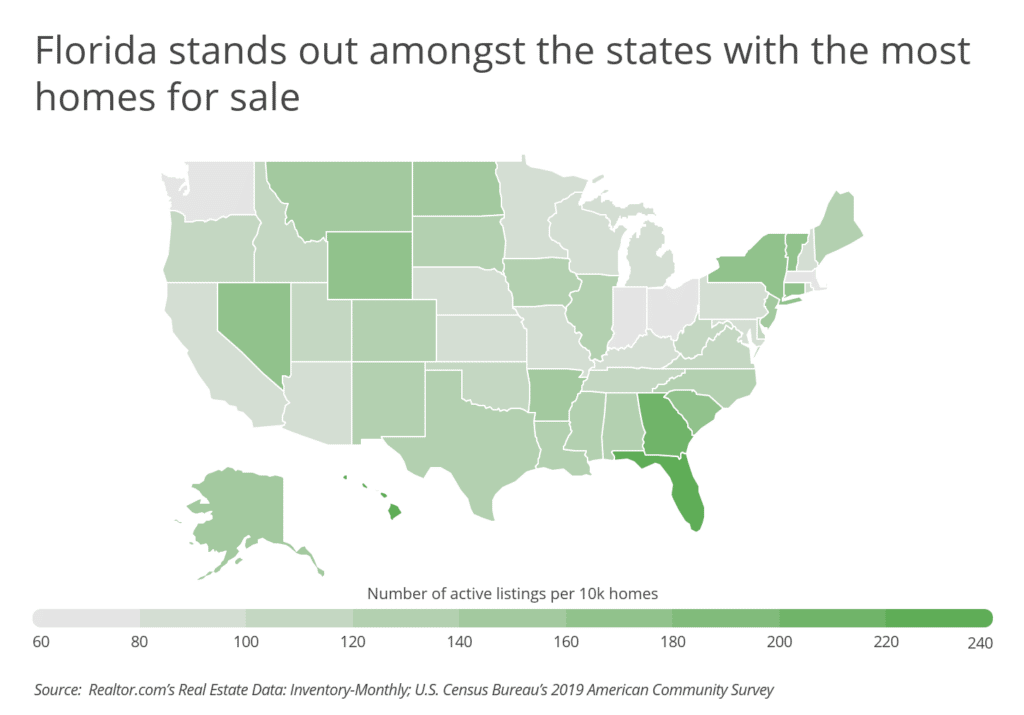
As is usually the case with real estate, these trends look different according to location. Many of the areas that still have a strong housing inventory are places that have seen increased home construction to accommodate a growing population. At the state level, Florida is the clear leader in the number of homes for sale, with 248 active listings per 10,000 homes, and Hawaii (229) and Georgia (210) are not far behind. In these locations, supply and demand are keeping pace with one another more than they are elsewhere. This makes them more favorable for buyers, because while there are more competitors in the market, there are also more options available.
The metro locations with fewer listings for sale in 2020 for the most part follow the same dominant national trends. In some communities, inventory is low because demand is high and properties are selling quickly. This is most apparent in high-growth locales like Seattle and Salt Lake City, where increased demand for homes from higher-income professionals means that the few properties that are on the market move fast and at high prices. But even in Rust Belt cities that have largely experienced economic decline in recent decades, like Buffalo, NY or Grand Rapids, MI, sellers are showing reticence to put their homes on the market out of fear they will have nowhere to go—a trend that has also dramatically reduced supply.
Where are the fewest houses for sale?
To find the locations with the most and fewest homes for sale, researchers from Inspection Support Network pulled data from Realtor.com and the U.S. Census Bureau. The research team calculated the average number of monthly active residential listings in 2020 per 10,000 owner-occupied homes. Researchers also pulled the average number of new listings per month, the year-over-year trends, and the median home price for reference.
Here are the large metros with the most and fewest homes for sale.
Large Metros With the Most Homes for Sale
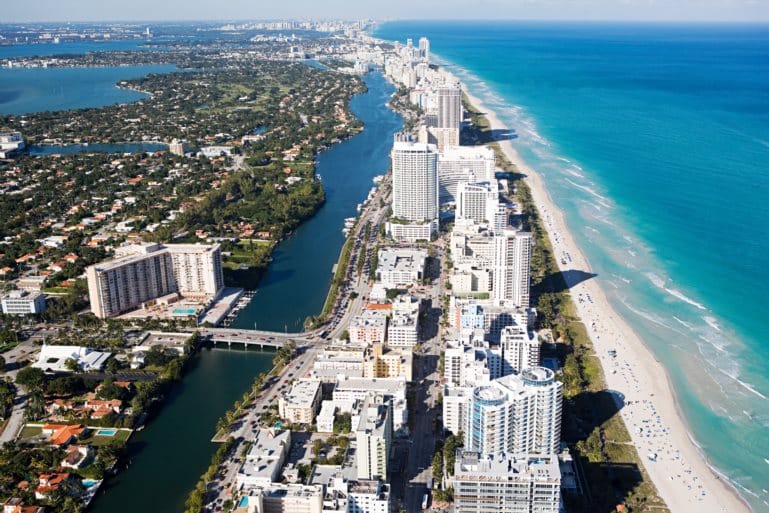
Photo Credit: Alamy Stock Photo
1. Miami-Fort Lauderdale-Pompano Beach, FL
- Number of active listings per 10k homes: 337
- Average number of active listings per month: 42,520
- Change in number of active listings (YoY): -13.3%
- Average number of new listings added per month: 10,421
- Median home price: $406,290

Photo Credit: Alamy Stock Photo
2. Atlanta-Sandy Springs-Alpharetta, GA
- Number of active listings per 10k homes: 219
- Average number of active listings per month: 30,072
- Change in number of active listings (YoY): -29.5%
- Average number of new listings added per month: 14,738
- Median home price: $341,267

Photo Credit: Alamy Stock Photo
3. New York-Newark-Jersey City, NY-NJ-PA
- Number of active listings per 10k homes: 190
- Average number of active listings per month: 68,144
- Change in number of active listings (YoY): -10.9%
- Average number of new listings added per month: 21,182
- Median home price: $594,540

Photo Credit: Alamy Stock Photo
4. Las Vegas-Henderson-Paradise, NV
- Number of active listings per 10k homes: 190
- Average number of active listings per month: 8,140
- Change in number of active listings (YoY): -11.8%
- Average number of new listings added per month: 3,386
- Median home price: $336,525
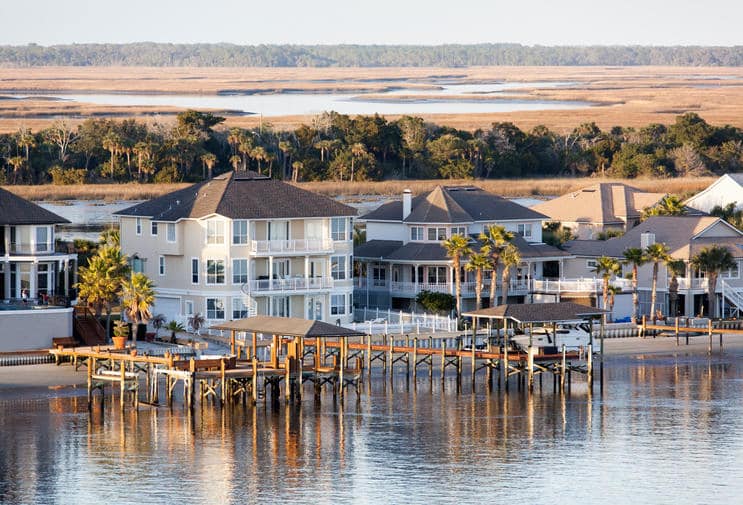
Photo Credit: Alamy Stock Photo
5. Jacksonville, FL
- Number of active listings per 10k homes: 184
- Average number of active listings per month: 6,563
- Change in number of active listings (YoY): -27.3%
- Average number of new listings added per month: 2,627
- Median home price: $317,683

Photo Credit: Alamy Stock Photo
6. Houston-The Woodlands-Sugar Land, TX
- Number of active listings per 10k homes: 164
- Average number of active listings per month: 22,882
- Change in number of active listings (YoY): -20.0%
- Average number of new listings added per month: 9,399
- Median home price: $322,238

Photo Credit: Alamy Stock Photo
7. San Antonio-New Braunfels, TX
- Number of active listings per 10k homes: 161
- Average number of active listings per month: 7,813
- Change in number of active listings (YoY): -22.4%
- Average number of new listings added per month: 3,269
- Median home price: $301,436

Photo Credit: Alamy Stock Photo
8. Orlando-Kissimmee-Sanford, FL
- Number of active listings per 10k homes: 158
- Average number of active listings per month: 8,072
- Change in number of active listings (YoY): -17.1%
- Average number of new listings added per month: 3,336
- Median home price: $321,205

Photo Credit: Alamy Stock Photo
9. Virginia Beach-Norfolk-Newport News, VA-NC
- Number of active listings per 10k homes: 156
- Average number of active listings per month: 6,252
- Change in number of active listings (YoY): -35.9%
- Average number of new listings added per month: 2,932
- Median home price: $320,631
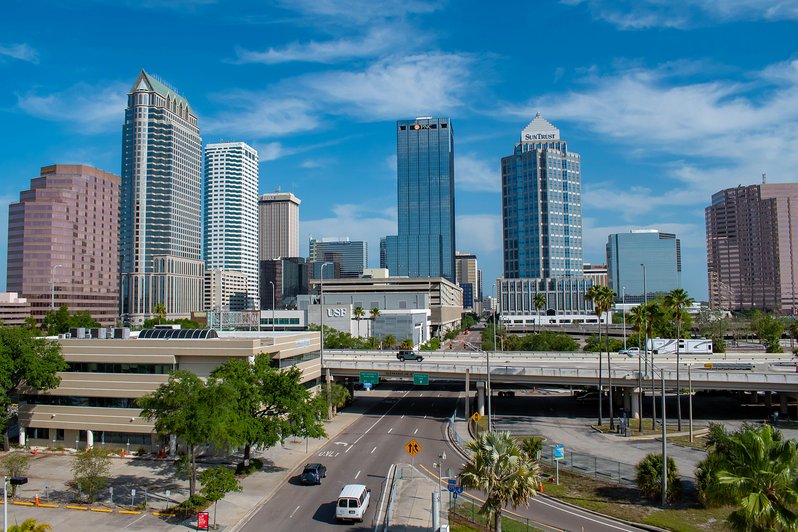
Photo Credit: Alamy Stock Photo
10. Tampa-St. Petersburg-Clearwater, FL
- Number of active listings per 10k homes: 137
- Average number of active listings per month: 10,069
- Change in number of active listings (YoY): -32.0%
- Average number of new listings added per month: 4,677
- Median home price: $292,308
Large Metros With the Fewest Homes for Sale

Photo Credit: Alamy Stock Photo
1. Buffalo-Cheektowaga, NY
- Number of active listings per 10k homes: 39
- Average number of active listings per month: 1,235
- Change in number of active listings (YoY): -32.9%
- Average number of new listings added per month: 825
- Median home price: $218,437

Photo Credit: Alamy Stock Photo
2. San Jose-Sunnyvale-Santa Clara, CA
- Number of active listings per 10k homes: 41
- Average number of active listings per month: 1,416
- Change in number of active listings (YoY): -23.2%
- Average number of new listings added per month: 1,215
- Median home price: $1,196,303

Photo Credit: Alamy Stock Photo
3. Rochester, NY
- Number of active listings per 10k homes: 49
- Average number of active listings per month: 1,373
- Change in number of active listings (YoY): -33.7%
- Average number of new listings added per month: 953
- Median home price: $237,036

Photo Credit: Alamy Stock Photo
4. Columbus, OH
- Number of active listings per 10k homes: 51
- Average number of active listings per month: 2,487
- Change in number of active listings (YoY): -19.8%
- Average number of new listings added per month: 1,799
- Median home price: $310,359

Photo Credit: Alamy Stock Photo
5. Milwaukee-Waukesha, WI
- Number of active listings per 10k homes: 52
- Average number of active listings per month: 1,946
- Change in number of active listings (YoY): -31.7%
- Average number of new listings added per month: 1,201
- Median home price: $328,346

Photo Credit: Alamy Stock Photo
6. San Francisco-Oakland-Berkeley, CA
- Number of active listings per 10k homes: 52
- Average number of active listings per month: 4,756
- Change in number of active listings (YoY): -12.2%
- Average number of new listings added per month: 3,689
- Median home price: $999,365

Photo Credit: Alamy Stock Photo
7. Salt Lake City, UT
- Number of active listings per 10k homes: 54
- Average number of active listings per month: 1,458
- Change in number of active listings (YoY): -42.7%
- Average number of new listings added per month: 1,185
- Median home price: $491,641

Photo Credit: Alamy Stock Photo
8. Seattle-Tacoma-Bellevue, WA
- Number of active listings per 10k homes: 56
- Average number of active listings per month: 4,936
- Change in number of active listings (YoY): -28.9%
- Average number of new listings added per month: 3,950
- Median home price: $617,868

Photo Credit: Alamy Stock Photo
9. Cincinnati, OH-KY-IN
- Number of active listings per 10k homes: 59
- Average number of active listings per month: 3,373
- Change in number of active listings (YoY): -38.1%
- Average number of new listings added per month: 1,921
- Median home price: $309,265

Photo Credit: Alamy Stock Photo
10. Grand Rapids-Kentwood, MI
- Number of active listings per 10k homes: 63
- Average number of active listings per month: 1,701
- Change in number of active listings (YoY): -28.5%
- Average number of new listings added per month: 1,036
- Median home price: $306,175
Detailed Findings & Methodology
The data used in this analysis is from Realtor.com’s Real Estate Data: Inventory-Monthly and the U.S. Census Bureau’s 2019 American Community Survey. To determine the locations with the most homes for sale, researchers calculated the average number of monthly active residential listings in 2020 per 10,000 owner-occupied homes. In the event of a tie, the location with the greater total number of active listings was ranked higher. To improve relevance, only metropolitan areas with at least 100,000 residents were included. Additionally, metros were grouped into cohorts based on population size: small (100,000–349,999), midsize (350,000–999,999), and large (1,000,000 or more).