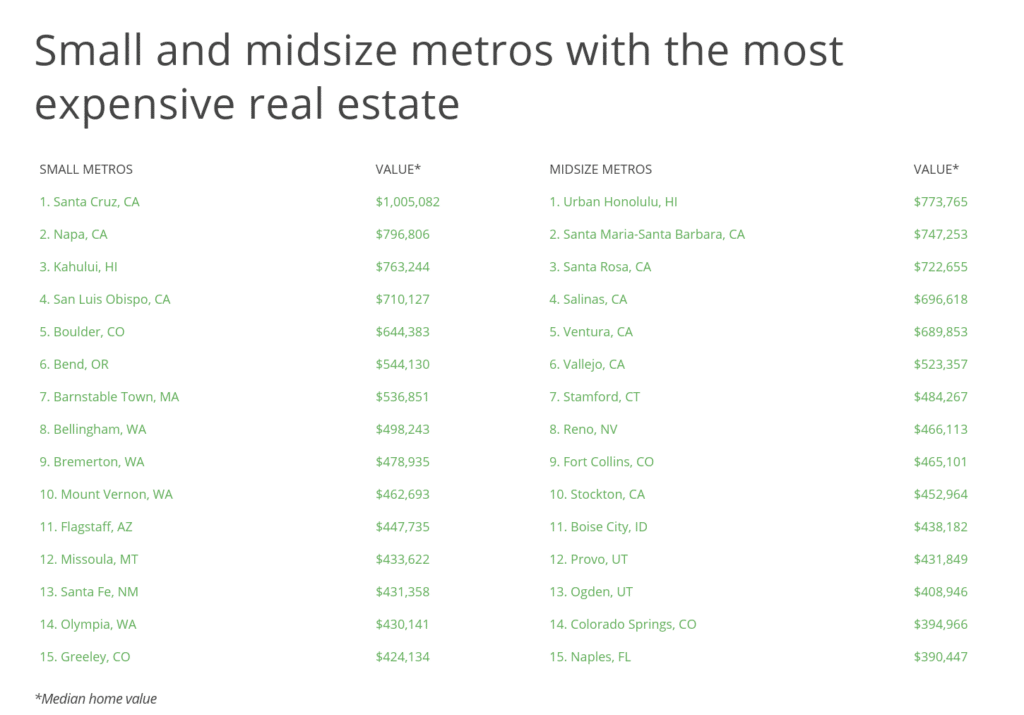
Cities With the Most Expensive Real Estate
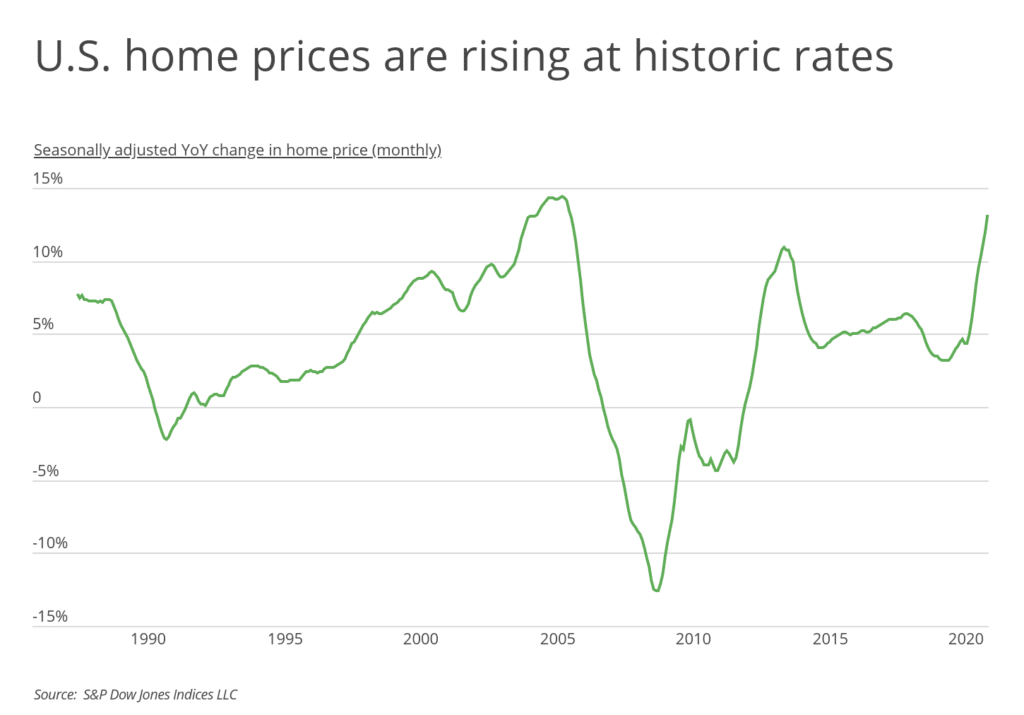
New data from the Case-Shiller Index reveals that the housing market is rising at a rate that hasn’t been seen in decades. While the year-over-year change in home prices hit a historic high in 2005, that housing boom was tame compared to 2021 when considering the speed at which prices have risen in the past year.
Home prices have been rising for over a decade; however, prices have been skyrocketing at near-record rates—13.2% in March 2021. Fueling the blazing housing market has been five main factors, according to a January 2021 analysis from Harvard University’s Joint Center for Housing Studies. These include a prolonged housing production shortfall since 2008; record-low mortgage rates; fewer homes for sale due to stay-at-home orders and pandemic concerns; a shift in family spending away from travel and entertainment toward housing; and an acceleration of second home purchase. These factors combined to spur housing price increases felt on national, state, and local levels.
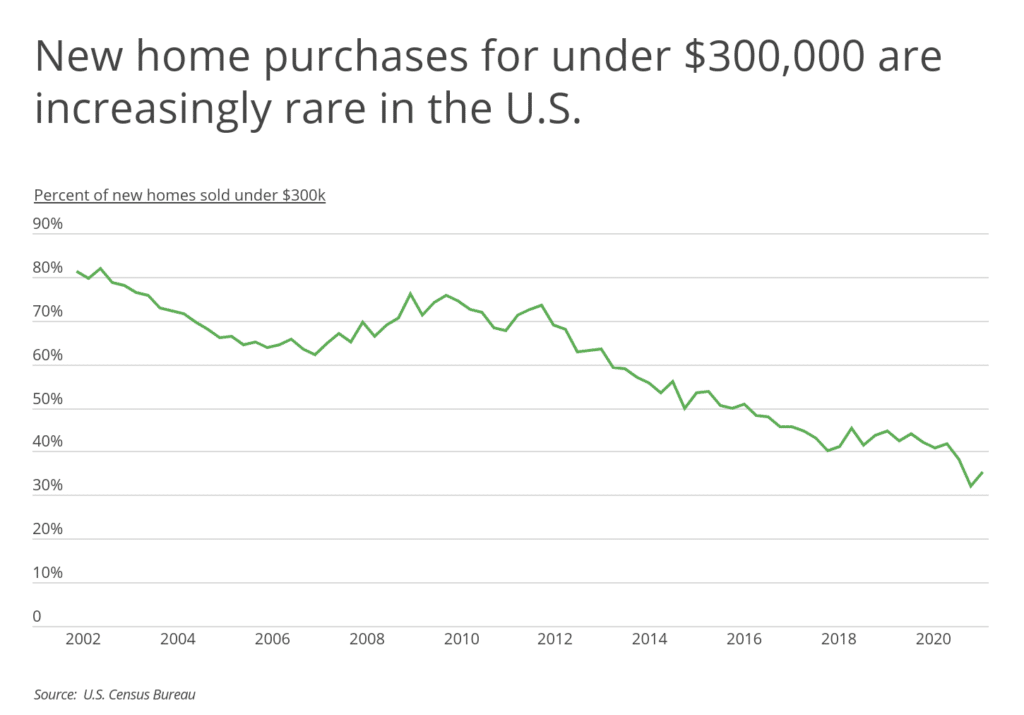
As homebuyers face the prospect of increasing prices, they also have to deal with another sobering reality: new homes priced under $300,000—approximately what the median American household would be able to afford—are increasingly rare. New residential sales data from the U.S. Census Bureau indicates that the percentage of homes under $300,000 dipped to 35.4% in Q1 2021, a decrease of more than 46 percentage points from Q3 2002 when 82% of new homes on the market cost less than $300,000.
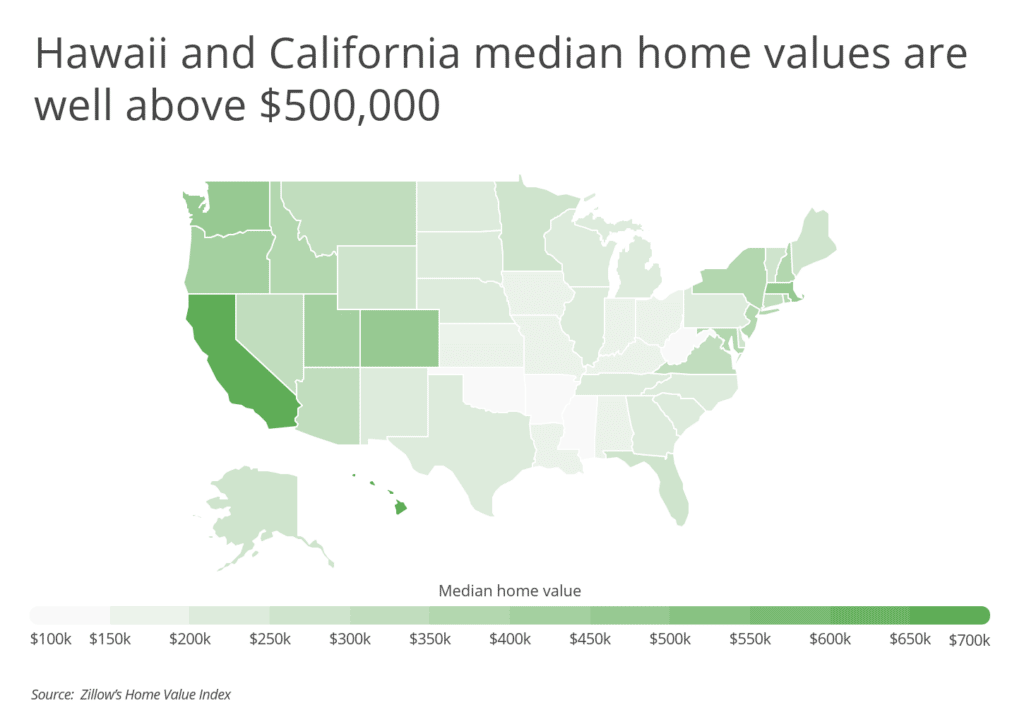
At the state level, homes are most expensive in Hawaii, where the median price is nearly $710,000, or about 150% higher than the national median price of $281,370. California is second at $654,629, which is also more than double the national median. Massachusetts and Washington are the third and fourth most expensive states, respectively, with home prices just under half a million dollars, according to data from Zillow.
At the opposite end of the spectrum, West Virginia’s median home price of $116,723 is the lowest in the nation and 58% lower than the national median. Other states in the South and Midwest, such as Mississippi, Arkansas, and Oklahoma, report similarly low prices alongside below-average year-over-year growth.
To determine the locations with the most expensive real estate, researchers at Inspection Support Network analyzed data from Zillow and the U.S. Census Bureau. The researchers calculated median home value using the most recent Zillow Home Value Index (ZHVI), and included the previous one-year change in home value, the forecasted future one-year change in home value, and median household income. To improve relevance, only metropolitan areas with at least 100,000 residents were included.
Additionally, metros were grouped into cohorts based on population size:
- Small: 100,000–349,999
- Midsize: 350,000–999,999
- Large: 1 million or more
Large Metros With the Most Expensive Real Estate
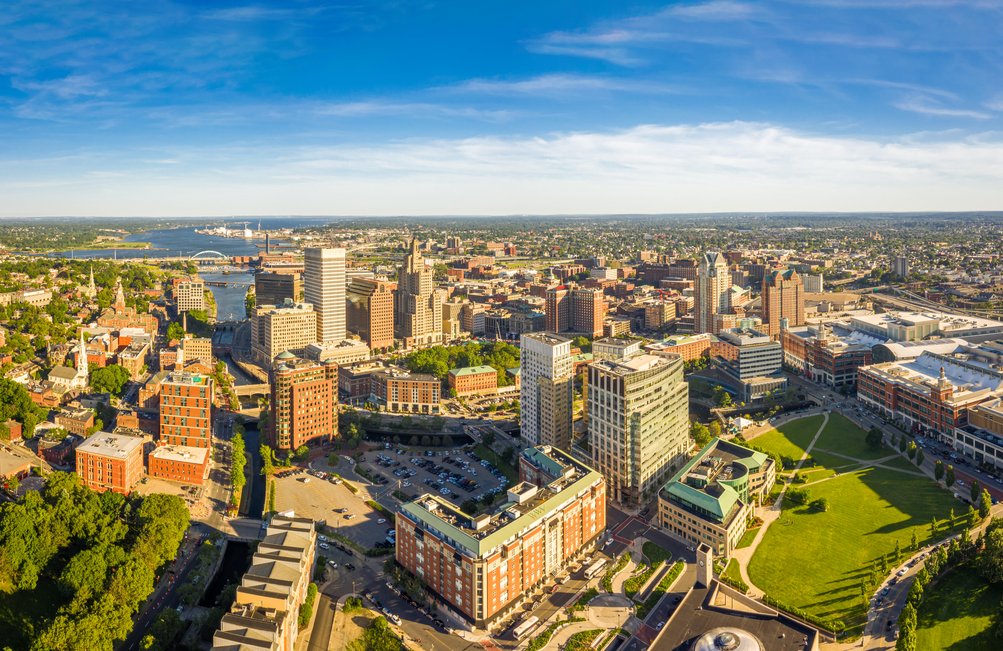
15. Providence, RI
- Median home value: $375,407
- Difference from national median: +33.4%
- Previous one-year change in home value: +15.0%
- Projected one-year change in home value: +11.4%
- Median household income: $67,818

14. Austin, TX
- Median home value: $441,931
- Difference from national median: +57.1%
- Previous one-year change in home value: +25.5%
- Projected one-year change in home value: +26.8%
- Median household income: $76,844

13. Riverside, CA
- Median home value: $460,833
- Difference from national median: +63.8%
- Previous one-year change in home value: +16.2%
- Projected one-year change in home value: +15.4%
- Median household income: $65,121
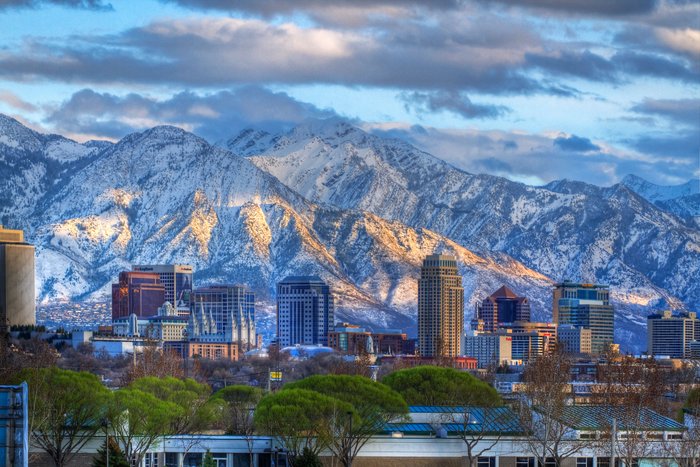
12. Salt Lake City, UT
- Median home value: $466,768
- Difference from national median: +65.9%
- Previous one-year change in home value: +18.3%
- Projected one-year change in home value: +16.9%
- Median household income: $74,842

11. Portland, OR
- Median home value: $482,708
- Difference from national median: +71.6%
- Previous one-year change in home value: +13.3%
- Projected one-year change in home value: +13.7%
- Median household income: $74,792

10. Washington, DC
- Median home value: $498,649
- Difference from national median: +77.2%
- Previous one-year change in home value: +11.5%
- Projected one-year change in home value: +11.8%
- Median household income: $103,751

9. Sacramento, CA
- Median home value: $507,735
- Difference from national median: +80.5%
- Previous one-year change in home value: +14.3%
- Projected one-year change in home value: +14.3%
- Median household income: $72,280

8. Denver, CO
- Median home value: $517,395
- Difference from national median: +83.9%
- Previous one-year change in home value: +12.9%
- Projected one-year change in home value: +13.6%
- Median household income: $79,664

7. New York, NY
- Median home value: $530,082
- Difference from national median: +88.4%
- Previous one-year change in home value: +9.5%
- Projected one-year change in home value: +8.5%
- Median household income: $78,773

6. Boston, MA
- Median home value: $563,149
- Difference from national median: +100.1%
- Previous one-year change in home value: +11.6%
- Projected one-year change in home value: +10.5%
- Median household income: $90,333

5. Seattle, WA
- Median home value: $627,290
- Difference from national median: +122.9%
- Previous one-year change in home value: +14.6%
- Projected one-year change in home value: +14.8%
- Median household income: $86,856
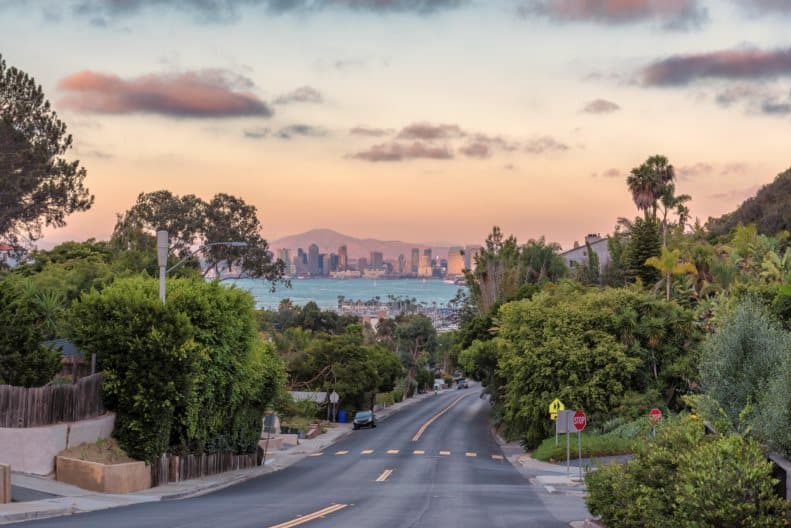
4. San Diego, CA
- Median home value: $729,318
- Difference from national median: +159.2%
- Previous one-year change in home value: +16.5%
- Projected one-year change in home value: +15.4%
- Median household income: $78,980

3. Los Angeles-Long Beach-Anaheim, CA
- Median home value: $783,610
- Difference from national median: +178.5%
- Previous one-year change in home value: +10.4%
- Projected one-year change in home value: +12.4%
- Median household income: $72,998

2. San Francisco, CA
- Median home value: $1,235,705
- Difference from national median: +339.2%
- Previous one-year change in home value: +7.4%
- Projected one-year change in home value: +14.1%
- Median household income: $106,025

1. San Jose, CA
- Median home value: $1,364,273
- Difference from national median: +384.9%
- Previous one-year change in home value: +5.9%
- Projected one-year change in home value: +11.2%
- Median household income: $122,478
Detailed Findings & Methodology
The data used in this analysis is from Zillow’s Home Value Index and the U.S. Census Bureau’s 2019 American Community Survey 5-Year Estimates. To determine the locations with the most expensive real estate, researchers determined the median home value using the most recent Zillow Home Value Index (ZHVI). Researchers also included the previous one-year change in home value and the forecasted one-year change in ZHVI looking ahead. To improve relevance, only metropolitan areas with at least 100,000 residents were included. Additionally, metros were grouped into cohorts based on population size: small (100,000–349,999), midsize (350,000–999,999), and large (1,000,000 or more).