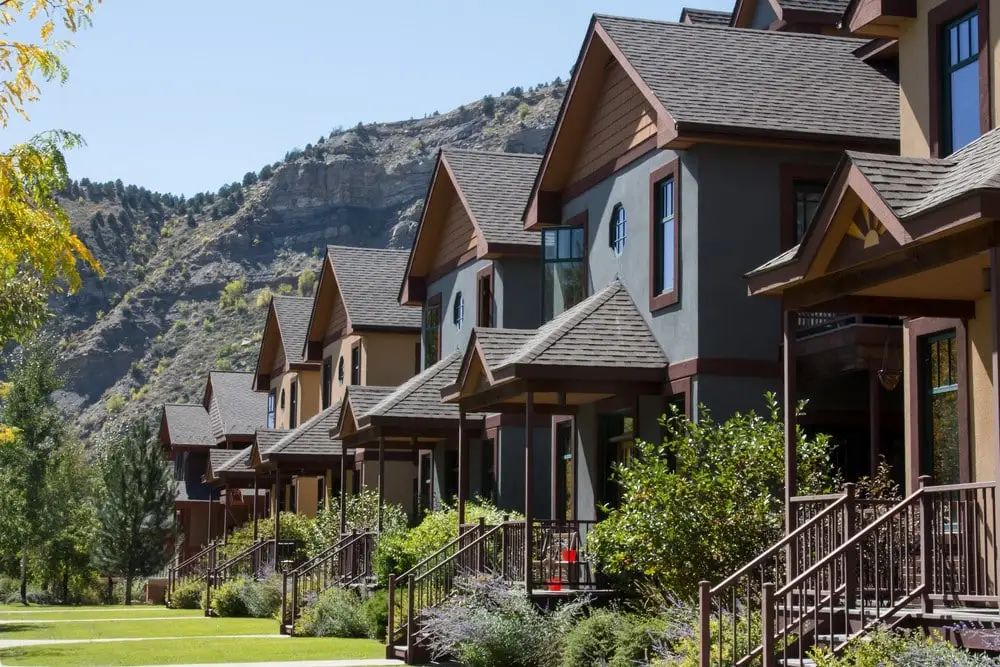
Most Americans like where they live, rating both their homes and neighborhoods favorably. According to the latest data on housing from the Census Bureau, the average U.S. householder rates their home an 8.37 and their neighborhood an 8.32 on a 10 point scale. Home opinions can be impacted by housing quality, having adequate space, amenities, and cost. Neighborhood opinions vary depending on the quality of nearby schools, crime, and social connectedness, among other factors.
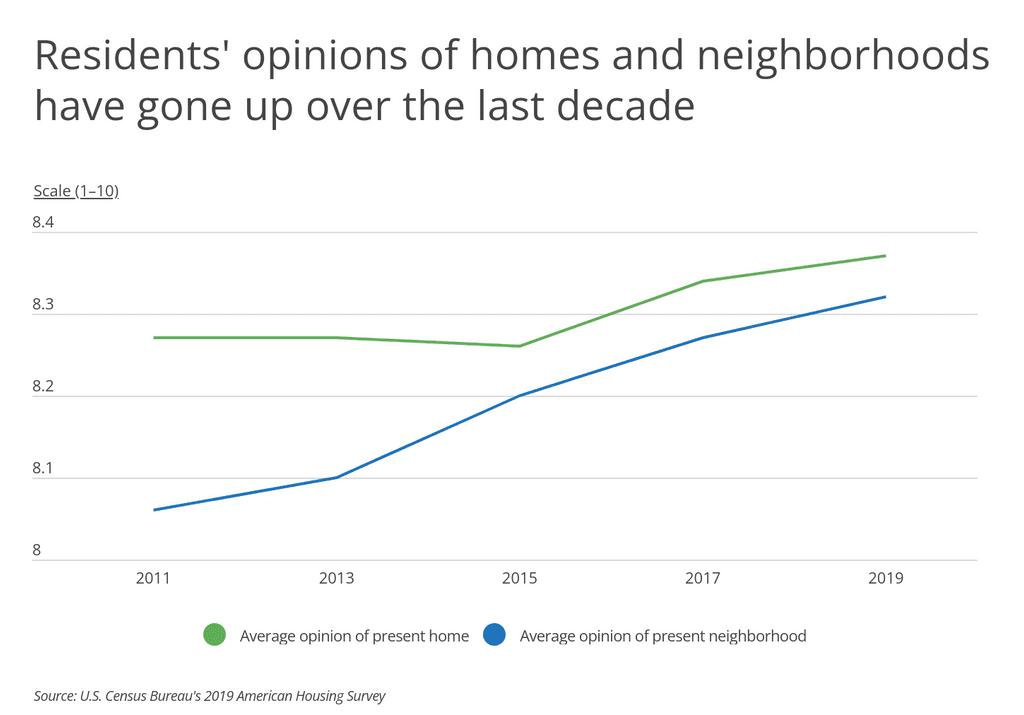
Residents’ average opinion of both their homes and neighborhoods have improved over the last decade. In 2011, residents’ average opinion of their home was 8.27 (on a scale from 1 to 10), with 30.5% of residents rating their home a 10 out of 10. By 2019, the average home rating had increased to 8.37, with 34.5% of residents giving their home the top mark. Neighborhood opinions have also improved, from an average rating of 8.06 in 2011 to 8.32 in 2019.
The rise in home and neighborhood opinions coincide with an overall increase in life satisfaction over the same time period. According to a Gallup poll on happiness and satisfaction with personal life, 78% of people reported being satisfied with their personal lives in 2011; by 2019, this figure had increased to 86%. Over the same time period, the share of people dissatisfied with their lives declined significantly, from 21% in 2011 to 13% in 2019. These increases in life satisfaction were accompanied by increased confidence in the U.S. economy and their own personal finances.
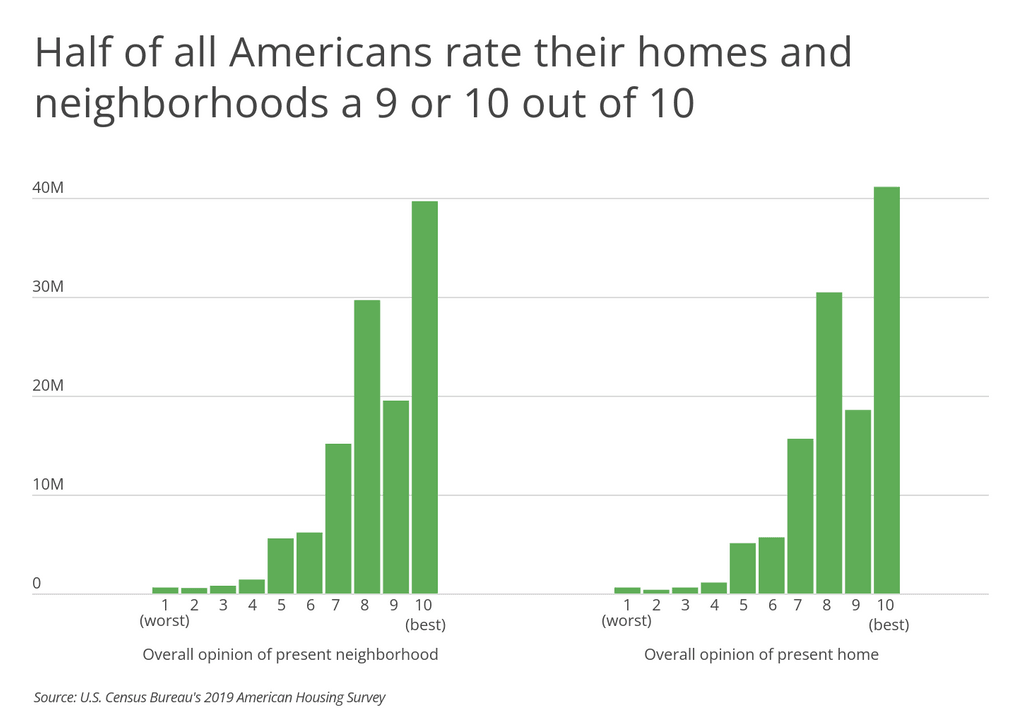
These statistics present an encouraging and perhaps undertold story about the nation’s housing stock. Despite the very real issues facing American households—such as the affordability crisis and the large share of cost-burdened households—only an extremely small proportion lack access to adequate living space. According to the Census Bureau, just over 1% of housing units are defined as severely inadequate—a condition characterized by a lack of basic necessities, such as plumbing, heating, electricity, and basic upkeep. When compared to other developed countries, there’s perhaps no better place to reside. According to the OECD Better Life Index, despite ranking low- to middle of the pack in areas like education and overall life satisfaction, the U.S. actually ranks first for housing, which considers both quality and affordability.
To find the metropolitan areas where residents are the most satisfied with their homes, researchers at Inspection Support Network analyzed the latest data from the U.S. Census Bureau’s American Housing Survey. The researchers ranked locations according to residents’ average response (on a 1–10 scale) of the overall opinion of their present home. Researchers also calculated the residents’ average opinion of their present neighborhood, median home purchase price, median square feet, and median household income.
The Census Bureau data only includes statistics from select states and metropolitan areas. Of these locations, here are the metros where residents are the most satisfied with their homes.
Major U.S. Metros Where Residents Are Most Satisfied With Their Homes

10. Dallas, TX
- Average opinion of present home (1–10 scale): 8.78
- Average opinion of present neighborhood (1–10 scale): 8.54
- Median home purchase price: $160,000
- Median square feet: 1,600
- Median household income: $66,000

9. Riverside, CA
- Average opinion of present home (1–10 scale): 8.79
- Average opinion of present neighborhood (1–10 scale): 8.58
- Median home purchase price: $226,000
- Median square feet: 1,504
- Median household income: $65,600

8. San Francisco, CA
- Average opinion of present home (1–10 scale): 8.80
- Average opinion of present neighborhood (1–10 scale): 8.67
- Median home purchase price: $456,000
- Median square feet: 1,223
- Median household income: $106,000
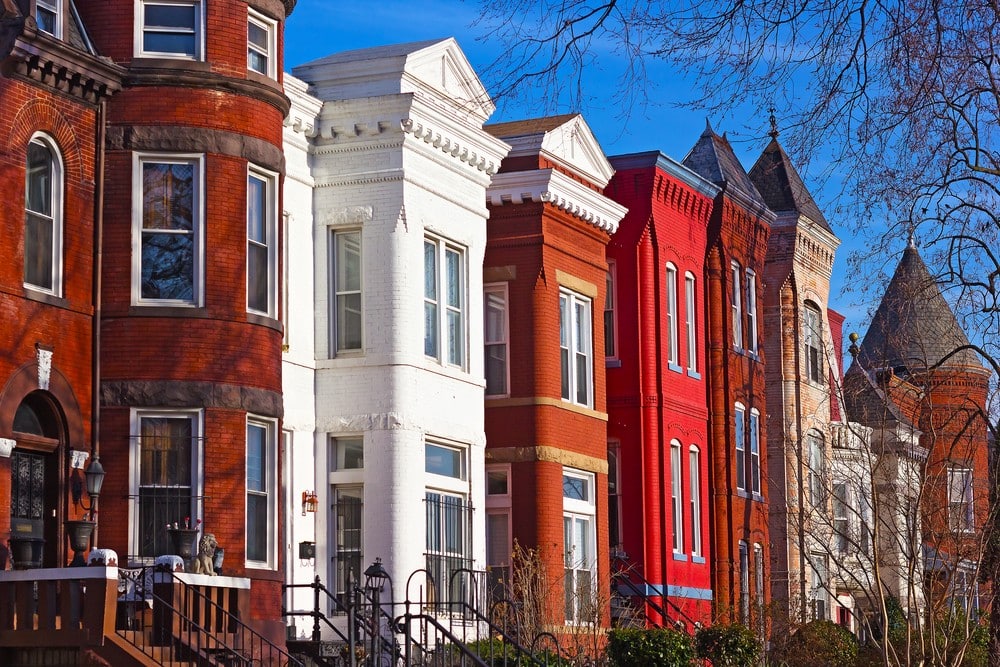
7. Washington, DC
- Average opinion of present home (1–10 scale): 8.82
- Average opinion of present neighborhood (1–10 scale): 8.68
- Median home purchase price: $313,000
- Median square feet: 1,600
- Median household income: $100,000
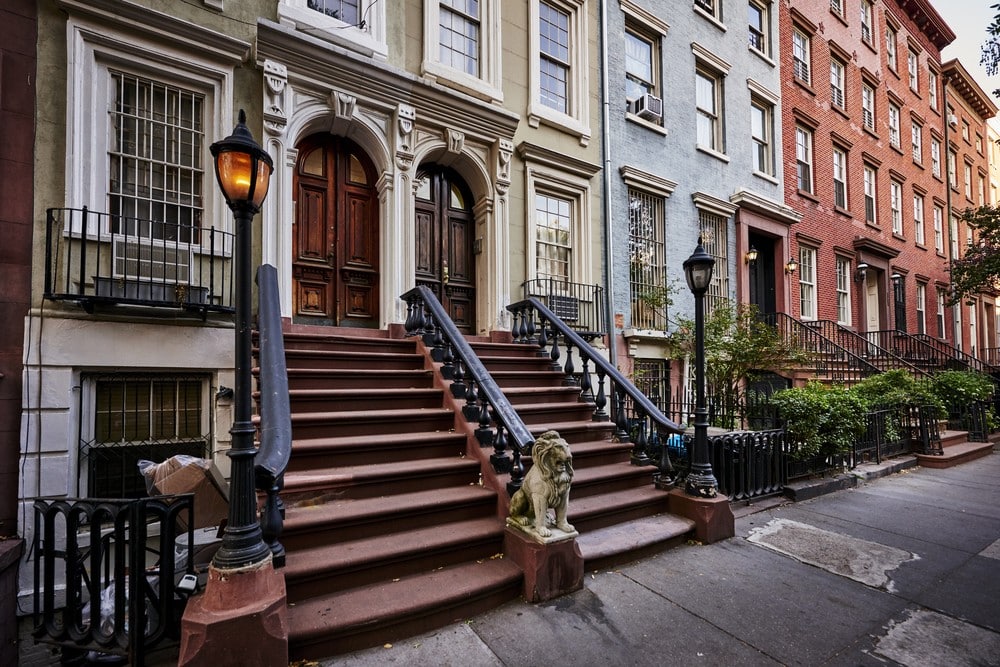
6. New York, NY
- Average opinion of present home (1–10 scale): 8.84
- Average opinion of present neighborhood (1–10 scale): 8.62
- Median home purchase price: $270,000
- Median square feet: 1,200
- Median household income: $70,000

5. Atlanta, GA
- Average opinion of present home (1–10 scale): 8.85
- Average opinion of present neighborhood (1–10 scale): 8.66
- Median home purchase price: $175,000
- Median square feet: 1,800
- Median household income: $69,000

4. Phoenix, AZ
- Average opinion of present home (1–10 scale): 8.89
- Average opinion of present neighborhood (1–10 scale): 8.59
- Median home purchase price: $195,000
- Median square feet: 1,600
- Median household income: $64,000
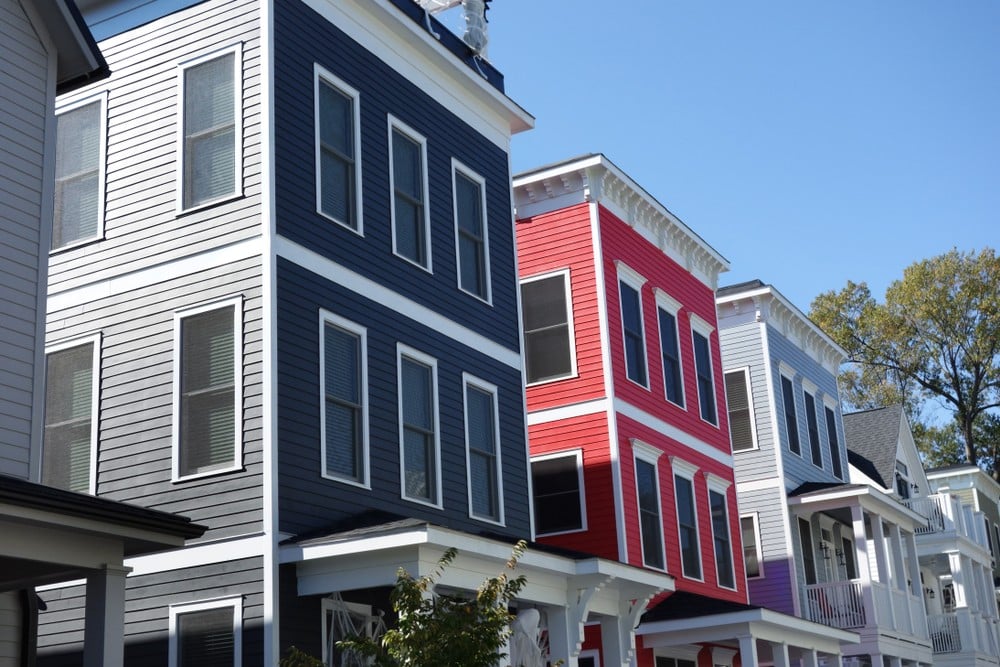
3. Raleigh, NC
- Average opinion of present home (1–10 scale): 8.90
- Average opinion of present neighborhood (1–10 scale): 8.77
- Median home purchase price: $200,000
- Median square feet: 1,700
- Median household income: $75,000

2. Boston, MA
- Average opinion of present home (1–10 scale): 8.92
- Average opinion of present neighborhood (1–10 scale): 8.88
- Median home purchase price: $285,000
- Median square feet: 1,499
- Median household income: $87,000
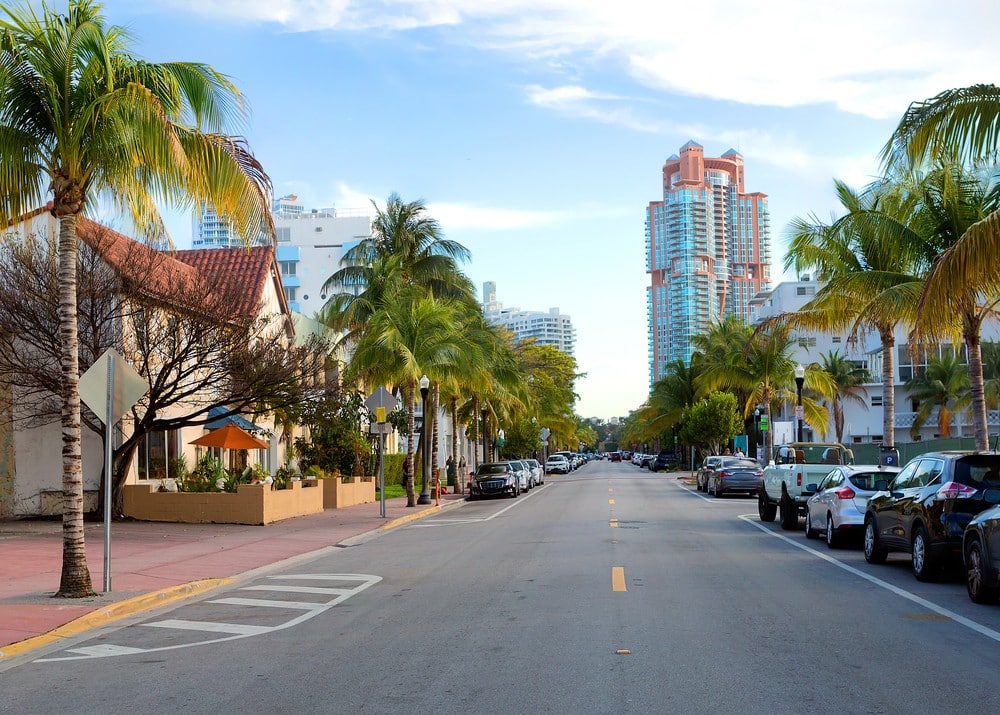
1. Miami, FL
- Average opinion of present home (1–10 scale): 8.96
- Average opinion of present neighborhood (1–10 scale): 8.79
- Median home purchase price: $170,000
- Median square feet: 1,350
- Median household income: $54,400
Detailed Findings & Methodology
To find the metropolitan areas where residents are the most and least satisfied with their homes, researchers at Inspection Support Network analyzed the latest data from the U.S. Census Bureau’s 2019 American Housing Survey. The researchers ranked locations according to residents’ average response (on a 1–10 scale) of the overall opinion of their present home. In the event of a tie, the metro with the higher average opinion of residents’ present neighborhood (1–10 scale) was ranked higher. Researchers also calculated the median home purchase price, median square feet, and median household income. The American Housing Survey only includes data from select states and metropolitan areas, and thus the analysis is limited to these select geographic areas.

