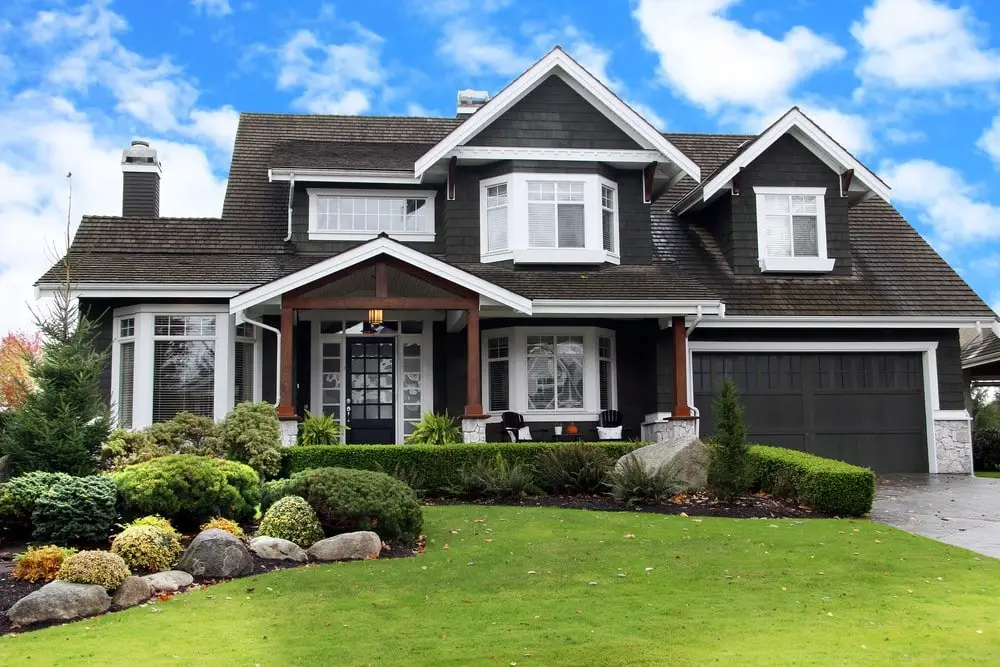
While the housing market has cooled in recent months, the last few years have seen a home-buying frenzy. Historically low interest rates, government stimulus payments, and high savings rates helped to ignite a housing boom, the likes of which have not been seen since 2006. At the same time, the COVID-19 pandemic caused a shift in home-buyer preferences, away from dense city living towards single-family homes with more living space, both indoors and out.
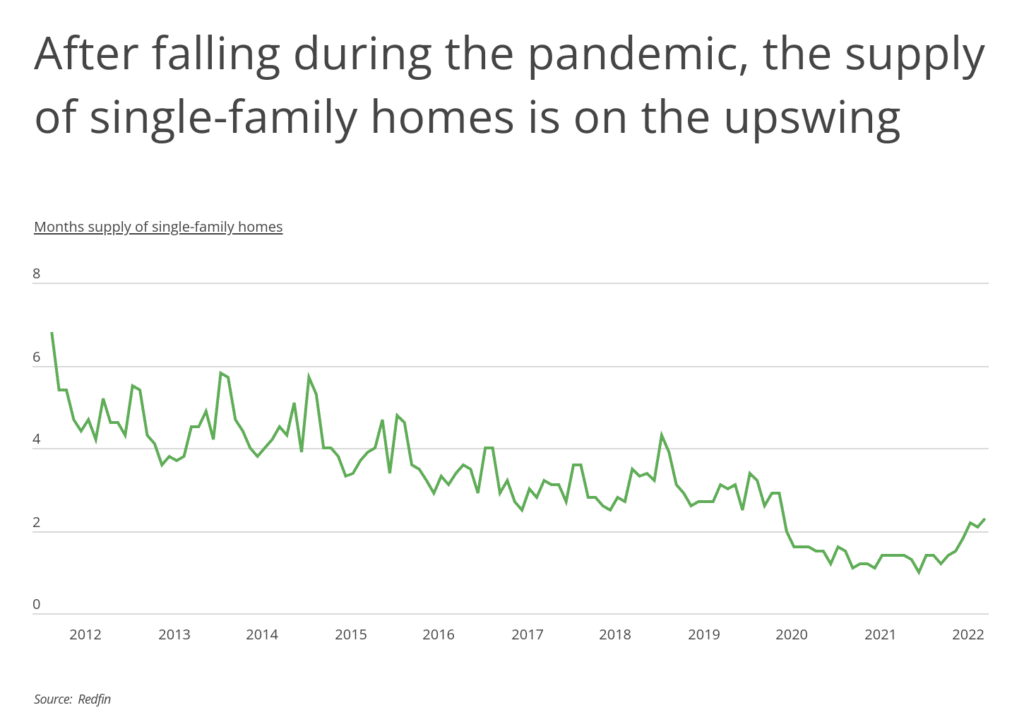
As the demand for single-family homes grew during the pandemic, the supply shrunk. In fact, the supply of single-family homes has been trending downwards for years due to a shortage of new home builds. Just over 10 years ago, in February 2012, there was a 6.8 months supply of single-family homes—in other words, it would have taken nearly seven months for the inventory of homes on the market to sell given demand at that time. Six months of supply is considered a balanced market between buyers and sellers, and tends to be associated with moderate price appreciation. Anything less than six months is viewed as a seller’s market, and home prices will increase more quickly.
Single-family home inventory dropped further during the pandemic, reaching a low of just a single month of supply in December 2021. However, single-family home inventory has climbed since March of this year as mortgage rates have risen.
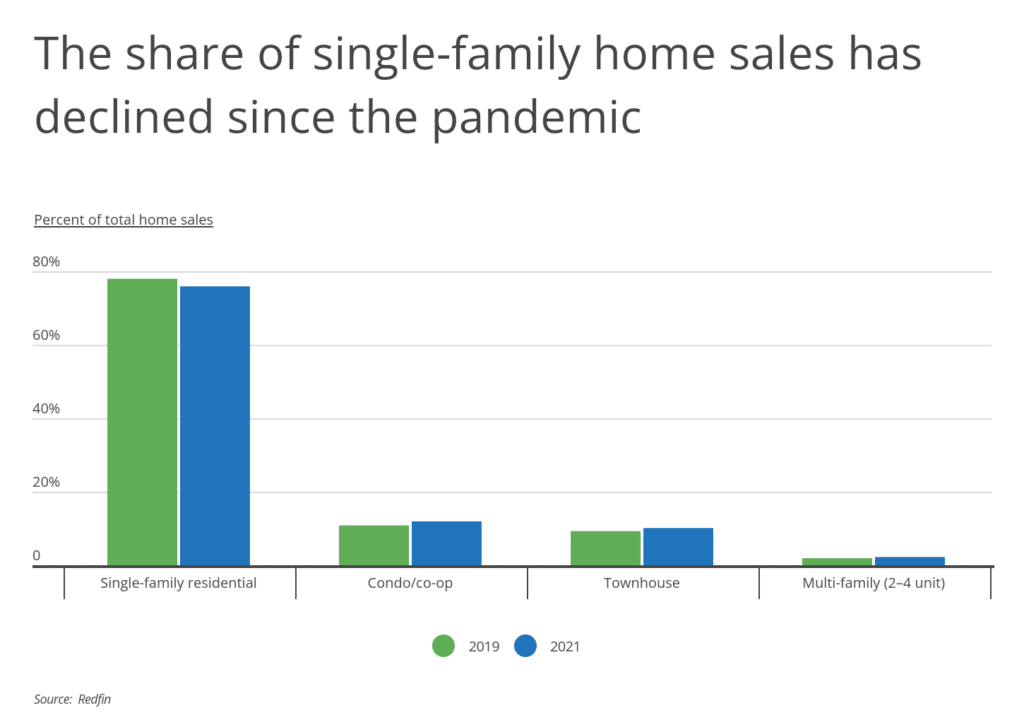
Making matters worse for would-be home buyers seeking single-family homes, single-family home sales represent a smaller share of total sales than they did before the pandemic. In 2019, single-family home sales accounted for less than 76% of total sales, down from 78% in 2019. At the same time, the share of condos, townhomes, and multi-family homes have all increased. Supply-chain disruptions due to the pandemic slowed down home building, contributing to the limited supply of single-family homes.
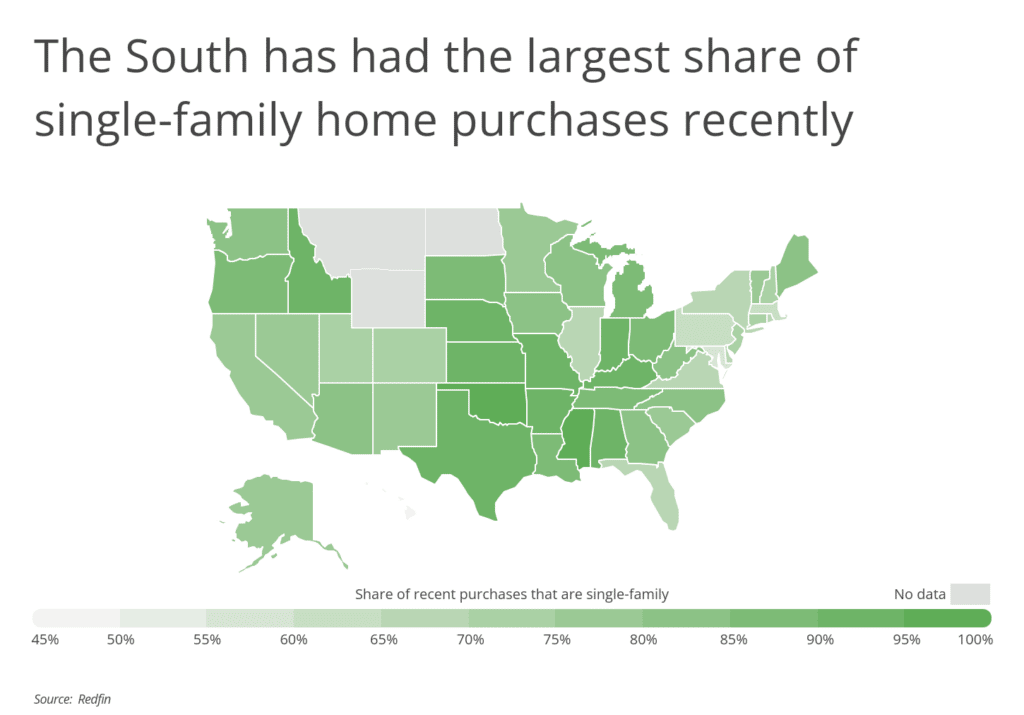
Some parts of the country have a greater supply of single-family homes than others.
At a regional level, the South has had the largest share of recent single-family home purchases (in 2021). The South has more rural and suburban areas, where single-family homes are the most common. In Oklahoma and Mississippi, 96.1% and 95% of recent home purchases were single-family, respectively, the highest shares in the U.S. The home-buying landscape looks much different in Maryland and Hawaii, however, where just 56.8% and 46.7% of recent home purchases are single-family, respectively.
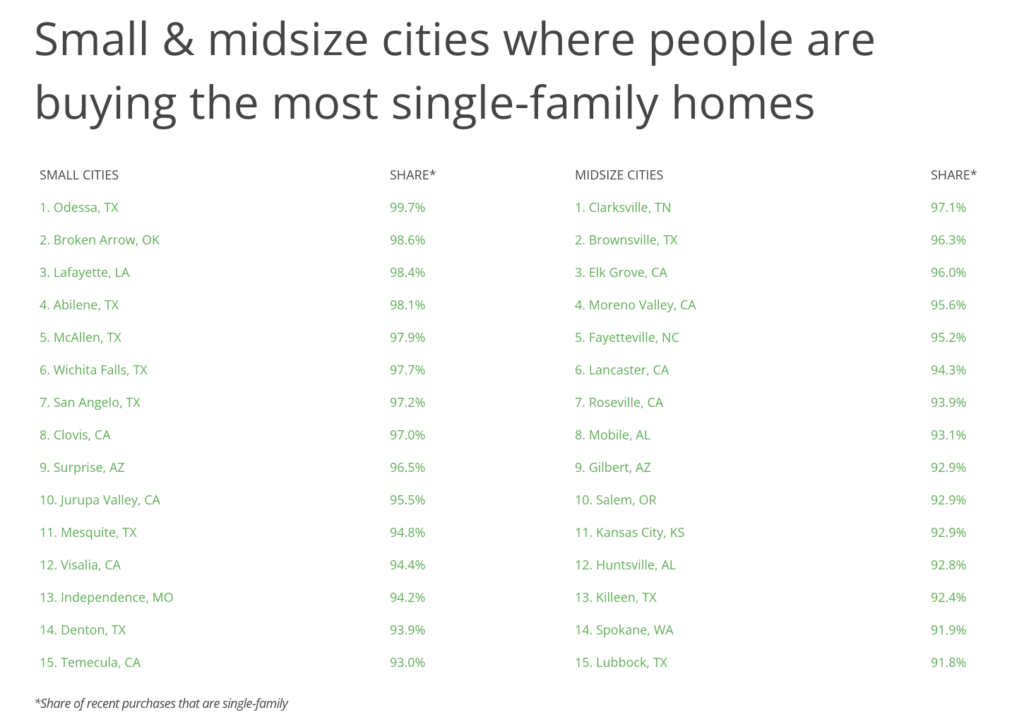
To find the cities where people are buying the most single-family homes, researchers at Inspection Support Network analyzed the latest data from the U.S. Census Bureau and Redfin. The researchers ranked cities according to the share of home purchases that are single-family in 2021. Researchers also calculated the median sale price for single-family homes, the share of all owner-occupied homes that are single-family, and the total number of owner-occupied single-family homes.
Here are the cities where people are buying the most single-family homes.
Large Cities Where People Are Buying the Most Single-Family Homes
 Photo Credit: Jacob Boomsma / Shutterstock
15. Tucson, AZ
- Share of recent purchases that are single-family: 81.8%
- Median sale price for single-family homes: $298,866
- Share of all owner-occupied homes that are single-family: 80.1%
- Total owner-occupied single-family homes: 91,844
 Photo Credit: Andriy Blokhin / Shutterstock
14. Sacramento, CA
- Share of recent purchases that are single-family: 86.0%
- Median sale price for single-family homes: $459,711
- Share of all owner-occupied homes that are single-family: 89.2%
- Total owner-occupied single-family homes: 92,748
 Photo Credit: Agnieszka Gaul / Shutterstock
13. Indianapolis, IN
- Share of recent purchases that are single-family: 86.6%
- Median sale price for single-family homes: $212,744
- Share of all owner-occupied homes that are single-family: 87.9%
- Total owner-occupied single-family homes: 176,727
 Photo Credit: Sean Pavone / Shutterstock
12. Kansas City, MO
- Share of recent purchases that are single-family: 86.7%
- Median sale price for single-family homes: $244,760
- Share of all owner-occupied homes that are single-family: 91.0%
- Total owner-occupied single-family homes: 107,713
 Photo Credit: Sean Pavone / Shutterstock
11. Memphis, TN
- Share of recent purchases that are single-family: 88.9%
- Median sale price for single-family homes: $179,619
- Share of all owner-occupied homes that are single-family: 92.2%
- Total owner-occupied single-family homes: 110,299
 Photo Credit: Peter Witham / Shutterstock
10. Arlington, TX
- Share of recent purchases that are single-family: 89.8%
- Median sale price for single-family homes: $289,679
- Share of all owner-occupied homes that are single-family: 95.3%
- Total owner-occupied single-family homes: 75,165
 Photo Credit: Valiik30 / Shutterstock
9. Tulsa, OK
- Share of recent purchases that are single-family: 90.6%
- Median sale price for single-family homes: $210,296
- Share of all owner-occupied homes that are single-family: 94.2%
- Total owner-occupied single-family homes: 84,098
 Photo Credit: Matt Gush / Shutterstock
8. Fresno, CA
- Share of recent purchases that are single-family: 90.7%
- Median sale price for single-family homes: $347,597
- Share of all owner-occupied homes that are single-family: 90.3%
- Total owner-occupied single-family homes: 82,377
 Photo Credit: Shawn Dorsey / Shutterstock
7. Omaha, NE
- Share of recent purchases that are single-family: 90.7%
- Median sale price for single-family homes: $230,304
- Share of all owner-occupied homes that are single-family: 92.3%
- Total owner-occupied single-family homes: 108,336
 Photo Credit: Matt Gush / Shutterstock
6. Bakersfield, CA
- Share of recent purchases that are single-family: 92.6%
- Median sale price for single-family homes: $340,865
- Share of all owner-occupied homes that are single-family: 92.7%
- Total owner-occupied single-family homes: 72,641
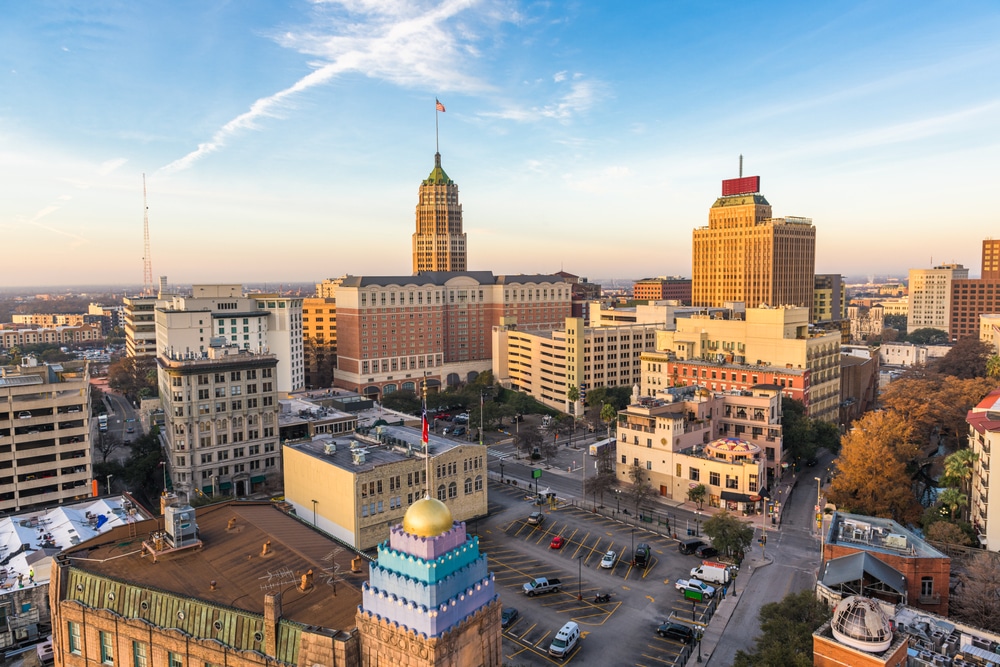 Photo Credit: Sean Pavone / Shutterstock
5. San Antonio, TX
- Share of recent purchases that are single-family: 93.2%
- Median sale price for single-family homes: $259,139
- Share of all owner-occupied homes that are single-family: 93.8%
- Total owner-occupied single-family homes: 271,999
 Photo Credit: Philip Lange / Shutterstock
4. Fort Worth, TX
- Share of recent purchases that are single-family: 94.2%
- Median sale price for single-family homes: $299,248
- Share of all owner-occupied homes that are single-family: 95.4%
- Total owner-occupied single-family homes: 176,591
 Photo Credit: Sean Pavone / Shutterstock
3. Oklahoma City, OK
- Share of recent purchases that are single-family: 94.4%
- Median sale price for single-family homes: $229,861
- Share of all owner-occupied homes that are single-family: 92.4%
- Total owner-occupied single-family homes: 152,025
 Photo Credit: Sean Pavone / Shutterstock
2. Wichita, KS
- Share of recent purchases that are single-family: 94.8%
- Median sale price for single-family homes: $194,614
- Share of all owner-occupied homes that are single-family: 92.7%
- Total owner-occupied single-family homes: 84,887
 Photo Credit: Sean Pavone / Shutterstock
1. El Paso, TX
- Share of recent purchases that are single-family: 96.5%
- Median sale price for single-family homes: $199,145
- Share of all owner-occupied homes that are single-family: 93.9%
- Total owner-occupied single-family homes: 138,842
Detailed Findings & Methodology
To find the cities where people are buying the most single-family homes, researchers at Inspection Support Network analyzed the latest data from the U.S. Census Bureau’s 2021 American Community Survey and Redfin. The researchers ranked cities according to the share of recent home purchases that are single-family in 2021. In the event of a tie, the city with the larger number of single-family home purchases was ranked higher. Researchers also calculated the median sale price for single-family homes, the share of all owner-occupied homes that are single-family, and the total number of owner-occupied single-family homes.
To improve relevance, only cities with at least 100,000 people and complete data across all metrics were included in the analysis. Additionally, cities were grouped into the following cohorts based on population size:
- Small cities: 100,000–149,999
- Midsize cities: 150,000–349,999
- Large cities: 350,000 or more

