What does the start of the latest housing forecast tell us about home inspection volume in 2026? March housing data shows a clear seasonal pickup, with both sales activity and inventory moving higher.
Existing home sales for March 2026 totaled 327,000 (non-seasonally adjusted), up +26.3% from February (February revised to 259,000) and +3.8% YoY, according to the National Association of Realtors (NAR). This reflects the start of the spring buying season, when activity typically ramps up.
Inventory is also climbing. Active listings reached 1.23 million homes in March, up +9.5% from February and +4.2% YoY, marking the 28th consecutive month of annual inventory gains, according to Zillow. More supply is entering the market, even as demand picks up.
Homes are also moving faster again. The median time to go pending dropped to 19 days in March, which is 9 days faster than February, though still 2 days longer than last year. As activity increases, timelines are tightening again.
Home prices remain stable with regional variation. The national median existing home price was $408,800, up +1.4% YoY. The Northeast (+5.7%) and Midwest (+4.9%) led gains, while the South (+0.8%) was nearly flat and the West declined -1.3%.
Mortgage rate expectations remain steady overall. Fannie Mae and the Mortgage Bankers Association (MBA) continue to project rates in the low-to-mid 6% range through 2026 and 2027. Fannie expects 6.2% in 2026 and 6.1% in 2027; MBA forecasts 6.1%-6.3%. Rates have fluctuated slightly in April but remain within that range.
Current Forecasts
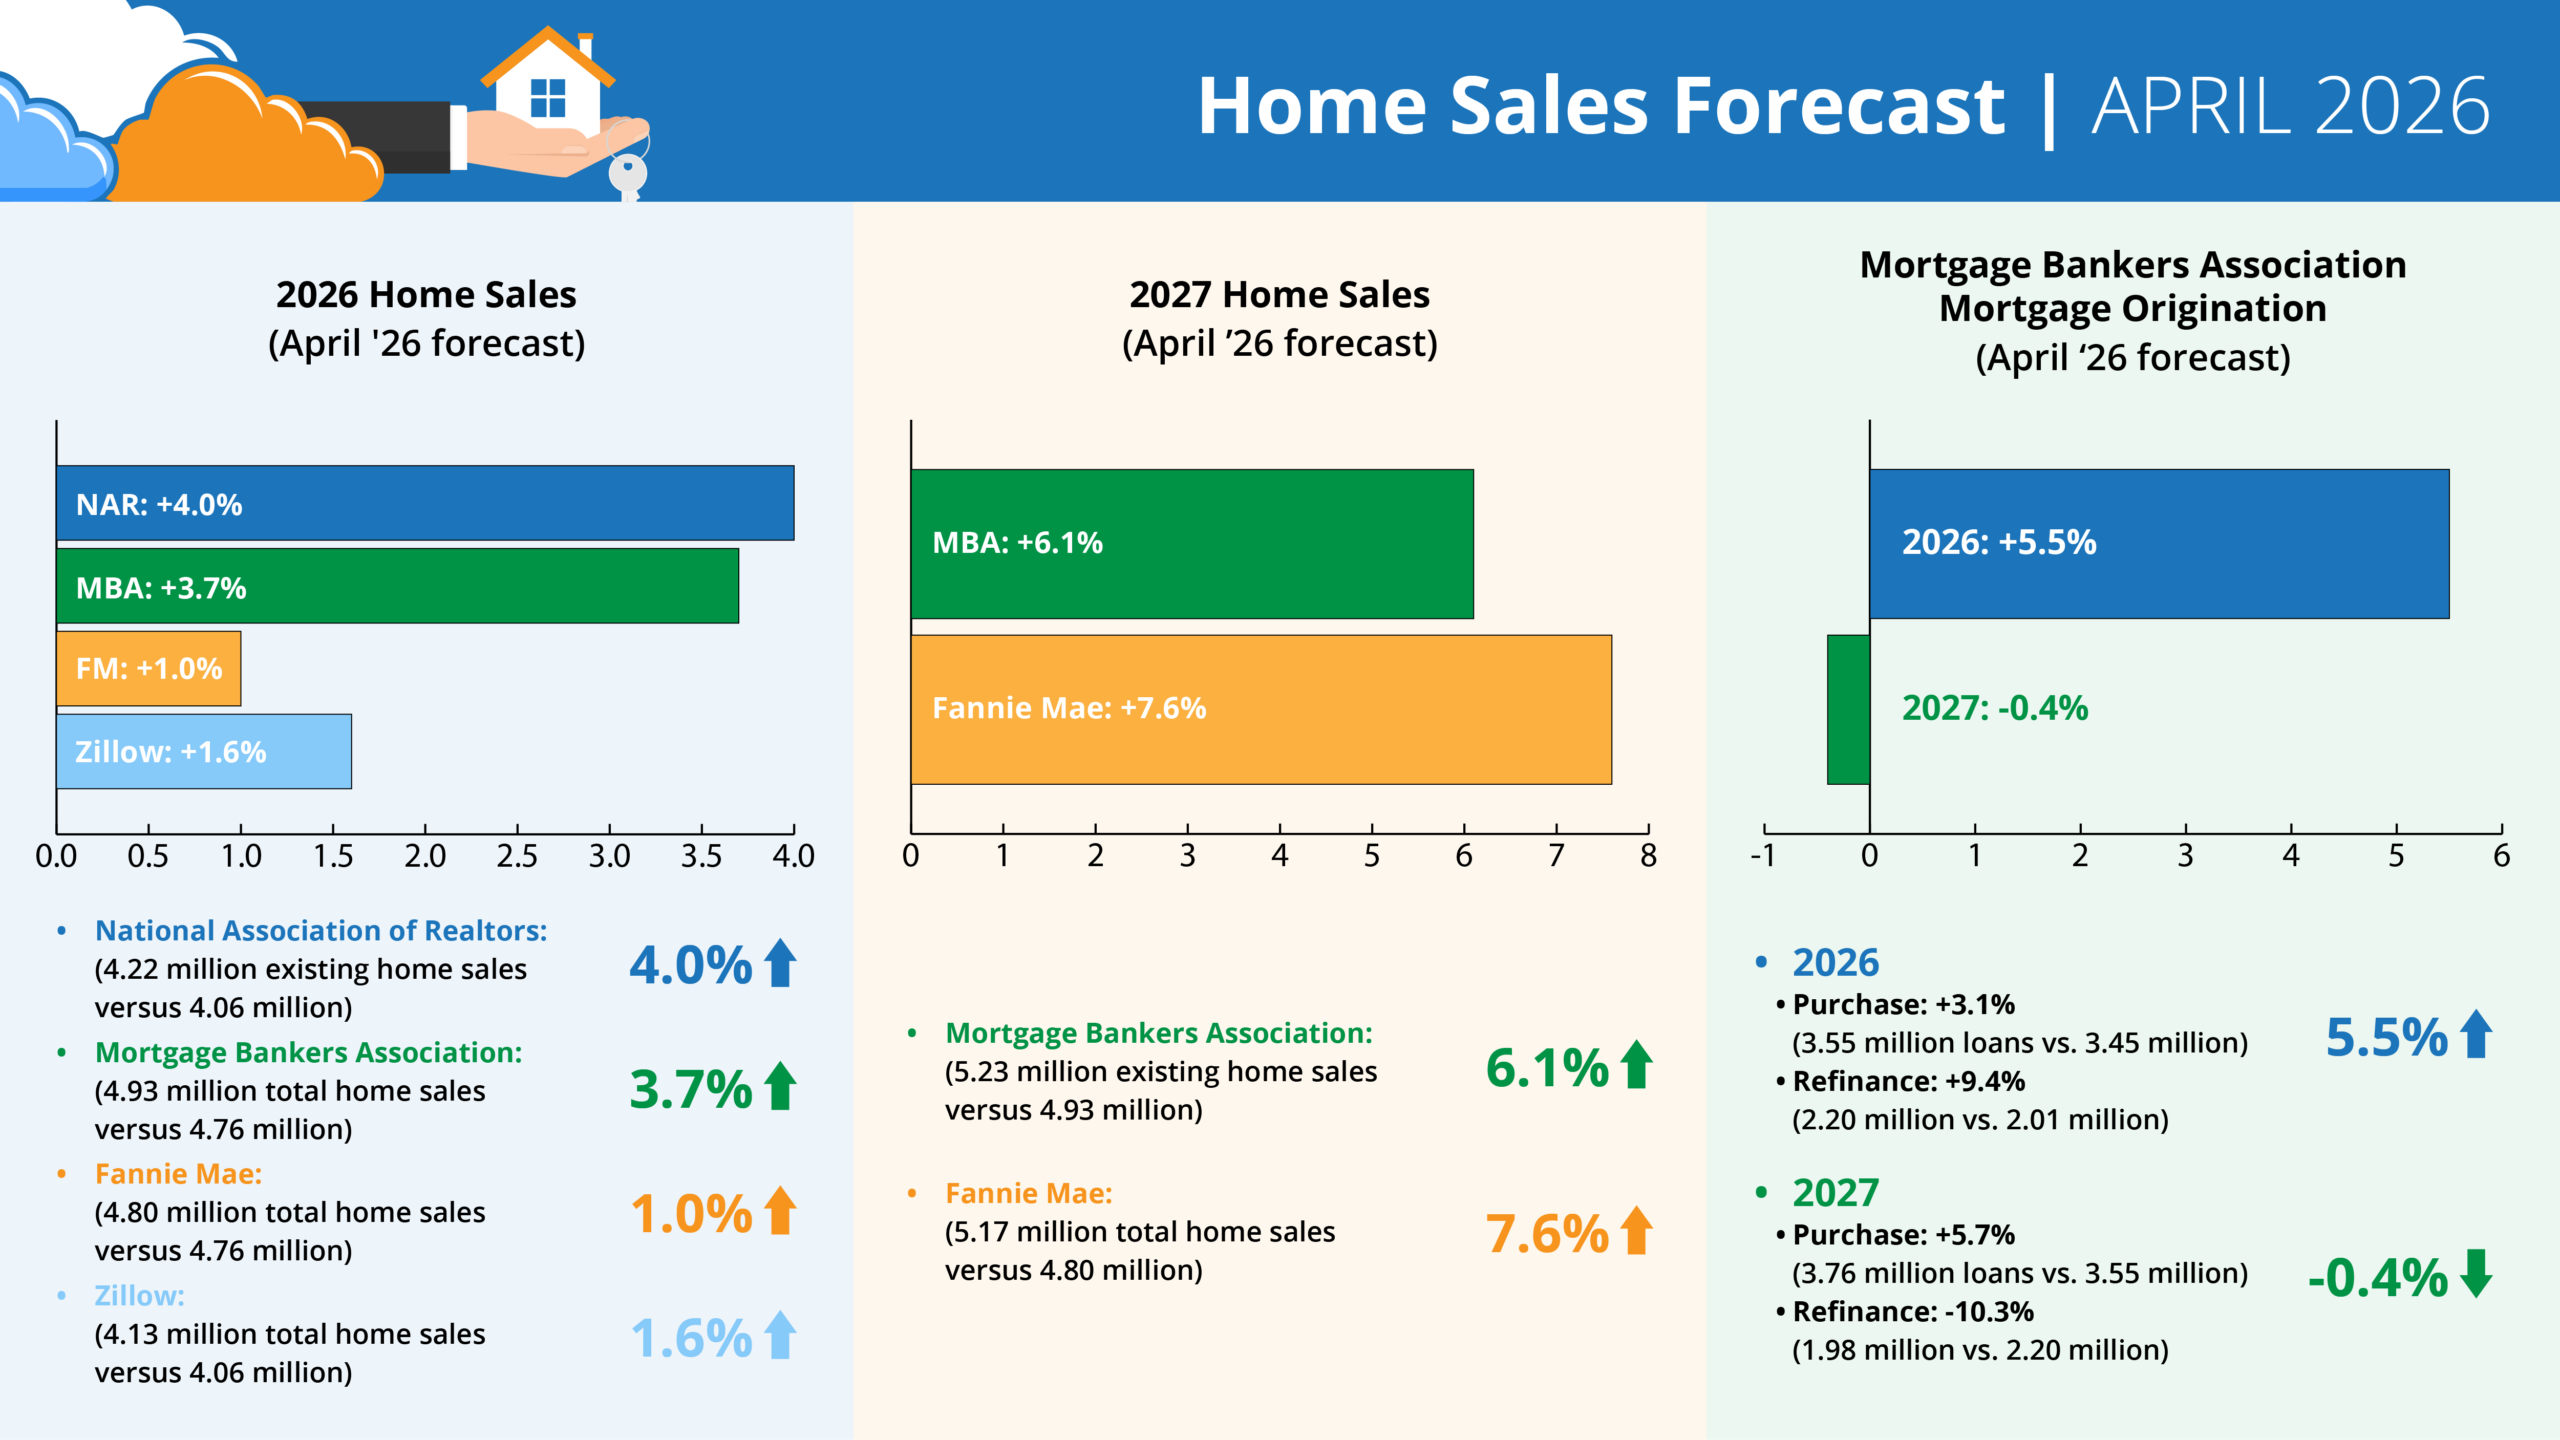
Forecasts for 2026 Home Sales (April ’26 forecast)
- NAR: +4.0% (4.22 million existing home sales vs. 4.06 million) – revised April 2026
- MBA: +3.7% (4.93 million total home sales vs. 4.76 million) – April ’26 forecast
- Fannie: +1% (4.80 million total home sales vs. 4.76 million) – April ’26 forecast
- Zillow: +1.6% (4.13 million existing home sales vs. 4.06 million) – April ’26 forecast
Forecasts for 2027 Home Sales (April ’26 forecast)
- MBA: +6.1% (5.23 million total home sales vs. 4.93 million) – April ’26 forecast
- Fannie: +7.6% (5.17 million total home sales vs. 4.80 million) – April ’26 forecast
MBA Forecast for Mortgage Originations (April ’26 forecast)
- 2026 Total Mortgage Originations: +5.5% (5.76 million loans vs. 5.46 million)
- Purchase: +3.1% (3.55 million loans vs. 3.45 million)
- Refi: +9.4% (2.20 million vs. 2.01 million)
- 2027 Total Mortgage Originations: -0.4% (5.73 million loans vs. 5.76 million)
- Purchase: +5.7% (3.76 million loans vs. 3.55 million)
- Refi: -10.3% (1.98 million vs. 2.2 million)
For multi-inspector teams, this is where things start to tighten up. More listings and faster timelines mean more scheduling pressure. If volume continues to build through the spring, teams that can handle quick turnarounds and keep jobs moving will be in the best position to take on the added work.
New to ISN or looking for home inspection software? Get started with a 30-day free trial today!