ISN’s breaking down the latest housing and lending data from leading industry organizations so you can stay ahead of the market. Whether you’re planning your staffing needs or deciding how to price your services, understanding real estate trends is key to staying competitive.
A look back at March 2025
- 315,000 existing homes were sold (non-seasonally adjusted), up 22.6% MoM, but down 3.1 YoY
- Inventory climbed 19.8% YoY, pushing supply up to 4.0 months – a sign of a shifting market
- Contract volumes rose 4.5% YoY, but price cuts surged 40.8%, suggesting buyers are still feeling the pinch
- The median closed price rose 4.8% YoY to $431,019
- Mortgage rates hovered between 6.5% and 7.0%, continuing to slow purchases in the lower price tiers
Forecasts from April 2025
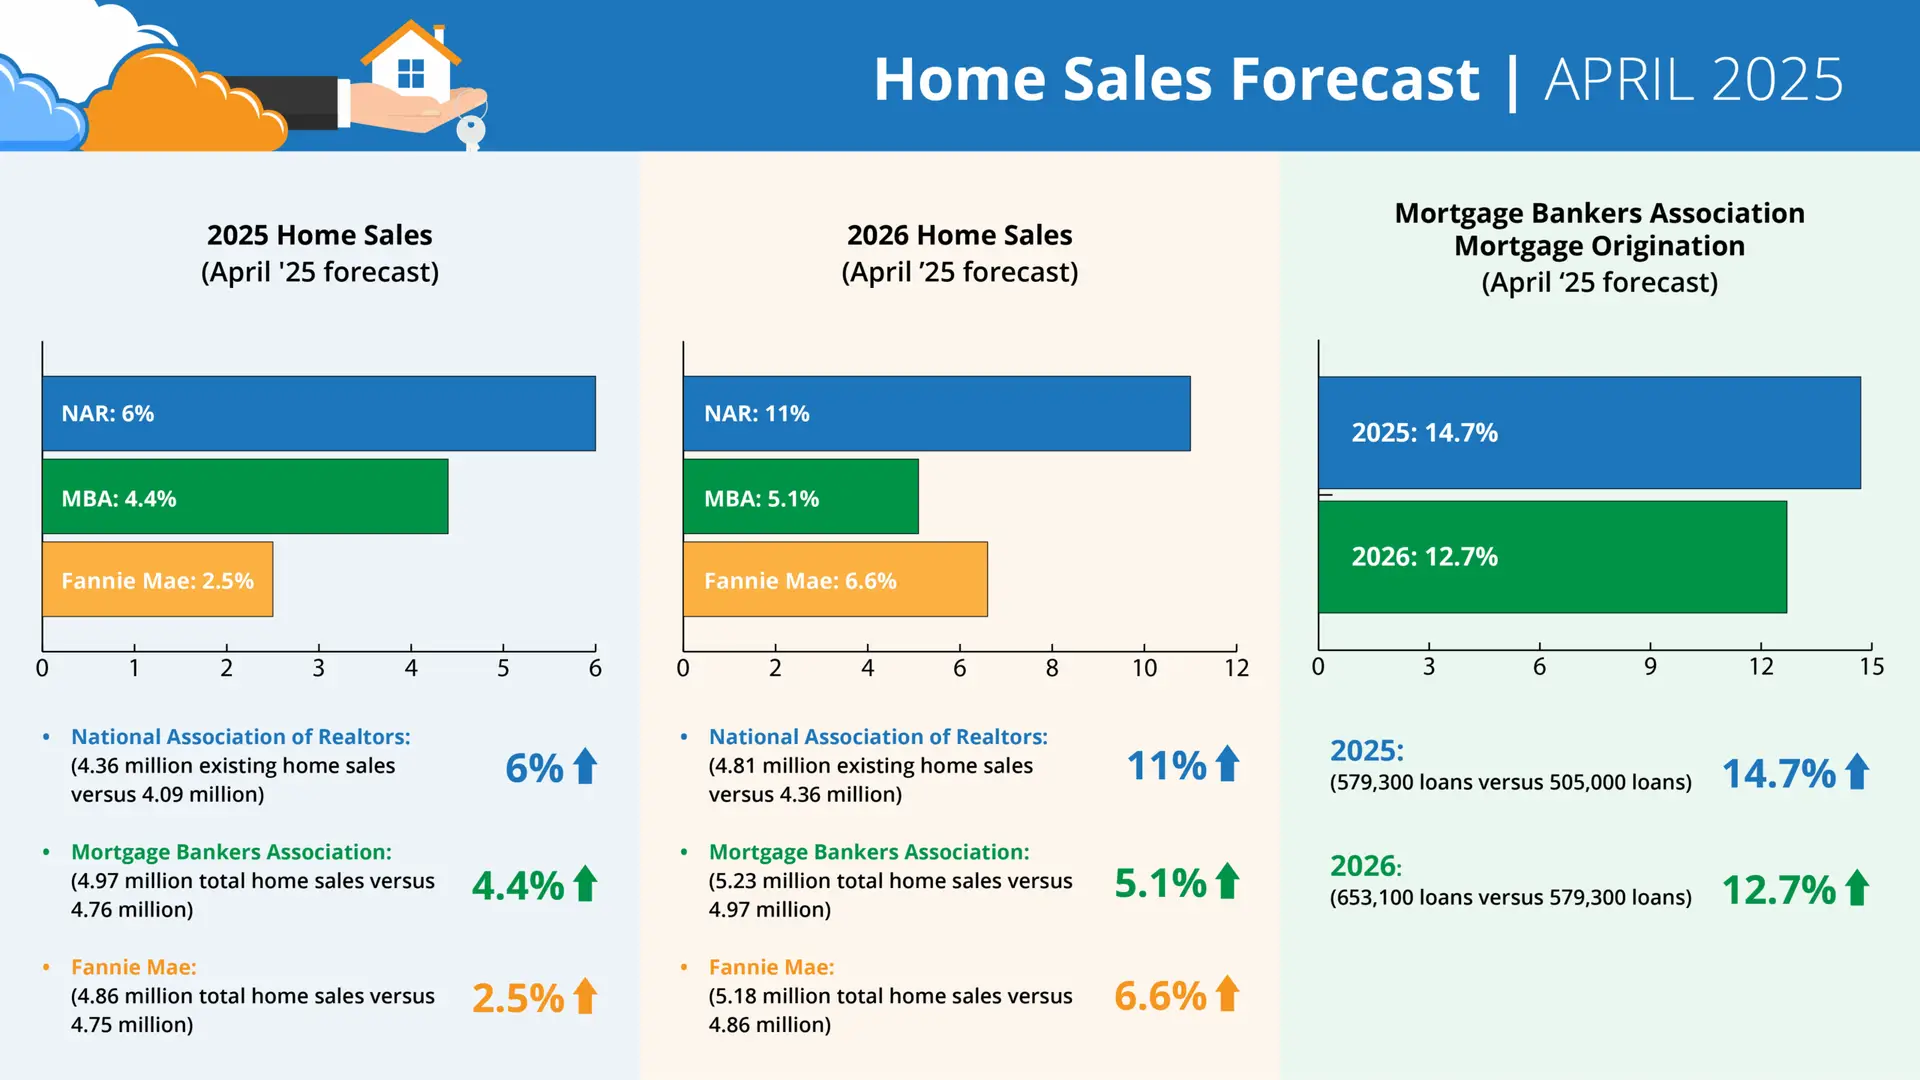
Annual home sales forecasts:
- NAR: 6% increase (4.36M vs. 4.09M)
- MBA: 4.4% increase (4.97M vs. 4.76M)
- Fannie Mae: 2.5% increase (4.86M vs. 4.75M)
2026 home sales forecasts:
- NAR: 11.0% increase (4.81M vs. 4.36M)
- MBA: 5.1% increase (5.23M vs. 4.97M)
- Fannie Mae: 6.6% increase (5.18M vs. 4.86M)
Mortgage Originations (MBA Forecast):
- 2025: 14.7% increase (579,300 vs. 505,000)
- 2026: 12.7% increase (653,100 vs. 579,300)
Data courtesy of the National Association of Realtors, Mortgage Bankers Association, Fannie Mae, and HouseCanary.
With more inventory entering the market and modest sales growth on the horizon, inspectors should keep a close eye on how these trends unfold – especially as buyers weigh affordability against opportunity.
ISN will continue to share these updates to keep you informed and agile.

